Interpreting November 2020 EB-5 Visa Availability Predictions from Charles Oppenheim
November 24, 2020 29 Comments
On November 19, 2020, IIUSA held a webinar about EB-5 visa availability with Charles Oppenheim. Chief of the Visa Control & Reporting Division at the U.S. Department of State.
Those who missed this information-rich presentation can purchase the recording here. IIUSA rightly makes Oppenheim’s slides available for free to the public.
The detail from Oppenheim’s visa availability presentation is particularly relevant for EB-5 investors from mainland China, Vietnam, India, and potentially South Korea. The rest of the world, you can skip this difficult post, except the first two questions (no news on consulates resuming normal operations, but good news for Hong Kong status).
My post organizes information from Oppenheim’s presentation around key questions, and interprets data from the slides with reference to Oppenheim’s explanations from the presentation, as well as information that I’ve gathered from other sources or read between the lines. (I apologize for the delay in this post. It was not easy to write, and I’ve also been spending time trying to earn some money with my business-plan-writing day job. If you’d like to help sponsor me and create compensation for this blog work, here’s a PayPal contribution link. I much appreciate the few readers who have stepped up in support. Meanwhile, I have other belated posts/comments coming soon to share more information about I-526 processing developments and discuss promising implications of changes in Washington.)
Are EB-5 applicants from Hong Kong now considered in the same category as Mainland China?
Oppenheim answer: “No. At this time Hong Kong is still at this point treated as a separate foreign state, for IV purposes, going forward.” (Clip from the recording.) This is great news for Hong Kong EB-5 applicants. Thank you Department of State for resisting chaos and holding firm to the law.
When will consular processing resume for EB-5 visa applicants?
Oppenheim still has “no idea” when consulates will return to normal processing status. With consular operations in question, Oppenheim currently estimates that EB-5 visas actually issued in Fiscal Year 2021 will be below the number theoretically available. (His estimates account for the fact that a quarter of FY2021 has already been lost for visa issuance abroad.) On the bright side, any family-based visas that likewise can’t be issued this year will increase the EB-5 quota again next year, providing some compensation/another chance to reduce the EB-5 backlog.
What’s the latest news about visa numbers issued and available?
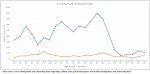
- Of the 11,112 EB-5 visa quota for FY2020, Department of State actually issued only 3,602 visas. (Thanks to consulates having been mostly non-operational since March 2020.)
- The EB-5 visa quota is 18,600 for FY2021, of which about 11,300 could potentially go to China (7% per-country quota of 1,302 visas plus the at least 10,000 visas likely leftover from the rest of the world). However, consulates are still not issuing visas, so actual visa issuance will again fall below the available limit. Oppenheim mentioned an in informal guess that it might be possible to actually issue about 3,000 visas to China and 600 to Vietnam in FY2021.
- The EB-5 visa quota for FY2022 may be at least 14,200, based on Oppenheim’s informal estimate that the EB category may be 200,000 in FY2022 due to another roll-over of family-based visa numbers.


Is the government willing or able to issue more EB-5 visas through adjustment of status, to compensate for ongoing limits on consular processing?
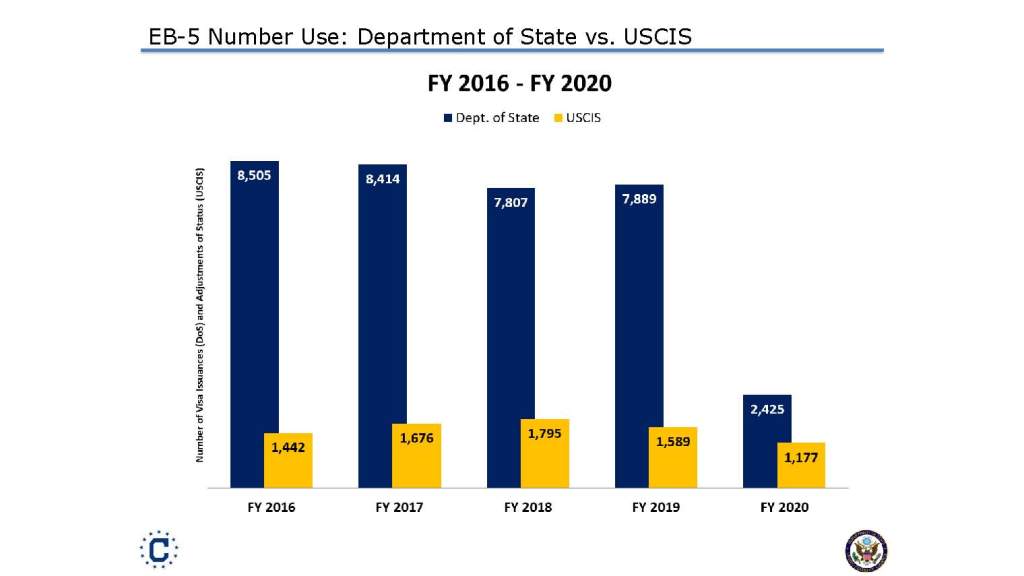
Oppenheim stated that the visa bulletin might be moved in FY2021 to accommodate adjustment of status for EB-5 applicants in the U.S., if consular processing abroad remains limited. That sounds promising. However, the numbers suggest that this did not happen in FY2020.
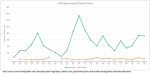
Per Oppenheim’s presentation, only 1,117 EB-5 visas were issued in FY2020 through adjustment of status – even fewer than in a normal year. (According to Annual Reports of the Visa Office 1,589 EB-5 visas were issued through adjustment of status in 2019, and 1,289 in 2018.) Adjustment of status in FY2020 was not limited by the EB-5 visa quota (since only 32% of available EB-5 visas were actually issued in the year), or by low demand (Oppenheim mentioned there are about 2,500 I-485 pending at USCIS for China-born applicants). Therefore, I guess there must have been a choice to not move the visa bulletin in FY2020 in a way that would let AOS applicants advance ahead of consular processing applicants. Alternatively, USCIS slowness blocked the path.
The China queue particularly suffered in 2020 with respect to status adjustment. The number of visas issued through status adjustment for China-born applicants in FY2020 was nearly identical to the numbers from 2019 and 2018 (489, 433, 481). China ended FY2020 with over 3,700 fewer issued visas than expected, despite apparently having 2,500 applicants ready to go through adjustment of status. I wonder how many fewer visas might have been lost for China, if Department of State had only moved China’s final action date more in FY2020 to maximize adjustment of status? Oppenheim informally estimated that it might be practically possible to issue 3,000 EB-5 visas to Chinese and 600 EB-5 visas to Vietnamese in FY2021, despite there technically being about 11,300 EB-5 visas available to China and 1,300 to Vietnam, this year. His pessimistic estimate must mean limited expectations for adjustment of status as well as consular processing in FY2021. But maybe the incoming administration will clear politically-motivated roadblocks from the immigration path more quickly than we expect.
What movement can we expect from the Visa Bulletin in FY2021?
- China: Oppenheim does not foresee advancing Chart B for China for the “foreseeable future” because, he said, almost 8,000 China-born applicants are already ready to go at the 12/15/2015 Chart B date. (If Oppenheim is right to guess that consulates/DOS can only practically manage to issue about 3,000 visas to China this year, and about 3,500 to 4,000 next year, then Chart B would not have to move for China until late next year. The picture would be different if consulates/DOS were able to actually issue the approximately 11,300 EB-5 visas that are technically available to China this year. It would also be different if the Visa Bulletin moved just to maximize adjustment of status for China while consulates remain nearly non-operational.)
- Vietnam: Oppenheim reports that about 475 applications are ready to go for Vietnam based on the December 2020 visa bulletin movement. That’s enough to go on for awhile, considering that the consulate in Vietnam is still only conducting handfuls of interviews, and that Vietnam apparently has very few EB-5 applicants using adjustment of status. (Combining Oppenheim’s numbers for total visa issuance with consular reports that I tracked in FY2020, it appears that only 8 Vietnamese got EB-5 visas through adjustment of status in the U.S. in FY2020.) But if Oppenheim is right that it will be practically possible to issue at least 600 of the 1,302 visas technically available to Vietnam this year, then the Visa Bulletin will have to move again for Vietnam later this year so that more than 475 applicants can get visas.
- India: It appears that Oppenheim expects India to say current in the Visa Bulletin throughout FY2021. He did not say this, but he left India off of the slide listing countries “at limit” in FY2021 (“Otherwise Unused EB-5 Numbers FY 2021 (Estimated)”). And I’m not surprised, since apparently about 87% of the India backlog is still stuck at the I-526 stage, where it’s practically unable to trigger the visa limit and visa bulletin. So long as the number of Indians who manage to reach the visa stage remains far below 1,300 (the number of visas technically available to India this year), India will not need visa bulletin limits this year. As of October 1, 2020, there were 799 Indians with applications on file at NVC. Oppenheim did not report how many Indians have pending I-485 in the U.S. but I gather that this number is rather off his radar. It doesn’t appear in his wait time calculation for India. (Combining Oppenheim’s numbers for total visa issuance in FY2020 with monthly consular reports that I tracked in FY2020, it appears that 301 Indians got EB-5 visas through AOS in FY2020 – about 50% of the India total. That’s relatively significant, and means maybe Oppenheim should be paying more attention to India demand through adjustment of status. On the other hand, maybe Oppenheim just reasonably assumes that USCIS will be too slow to advance another 500 Indian applicants to the visa stage in time to push India over the FY2021 visa limit.) If Oppenheim does not expect India to reach the visa limit this year, that’s mixed news. A current visa bulletin will be good for Indians near the front of the line — those who manage to get past I-526 approval this year — since they can proceed unhindered to file visa applications and potentially get final action. On the other hand, it’s bad news for Indians currently nearer the back of the line, because it means that the visa line ahead is moving slowly, and will be reduced this year by much less than the 1,300 applicants who would have exited the line if India were able to reach its visa limit this year.
- Other countries: No other countries are expected to reach visa limits this year.
How can I interpret the EB-5 visa wait time estimate?
Visa wait time estimates use a simple formula: A/B=C, where A is estimated number of people currently in line for a visa, and B is estimated average number of visas available per year.
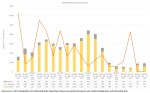
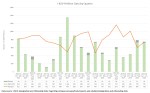
This calculation appears on the following two slides that we eagerly await in each presentation. The orange column in the first slide is variable A, the blue bars in the second slide represent result C, and Oppenheim’s assumption about variable B can be inferred from A/C. I’ve put a table below the slides clarifying how the calculation works.

Interpretation of the slide “EB-5 Applicants with Petitions on file at NVC and Estimated USCIS Applicant Data as of 10/1/2020“
| Country | Actual # applicants at NVC | DOS estimated # applicants with petition on file at USCIS | Estimated Total | Estimated years to visa availability for a petition filed “today” | Implied assumption of average visas issued per year |
| i | ii | A=i+ii | C=A/B | B=A/C, rounded (unrounded, there’s unexplained difference for ROW countries) | |
| Brazil | 274 | 940 | 1,214 | 1.8 | 700 |
| China Mainland | 44,803 | 12,158 | 56,961 | 17.2 | 3300 |
| India | 799 | 4,966 | 5,765 | 7.8 | 700 |
| South Korea | 205 | 2,594 | 2,799 | 3.8 | 700 |
| China Taiwan | 148 | 1,535 | 1,683 | 2.4 | 700 |
| Vietnam | 1,662 | 3,837 | 5,499 | 7.9 | 700 |
| Rest of World | 1,172 | 7,910 | 9,082 | ||
| Grand Total | 49,063 | 33,940 | 83,003 |
A few points to note:
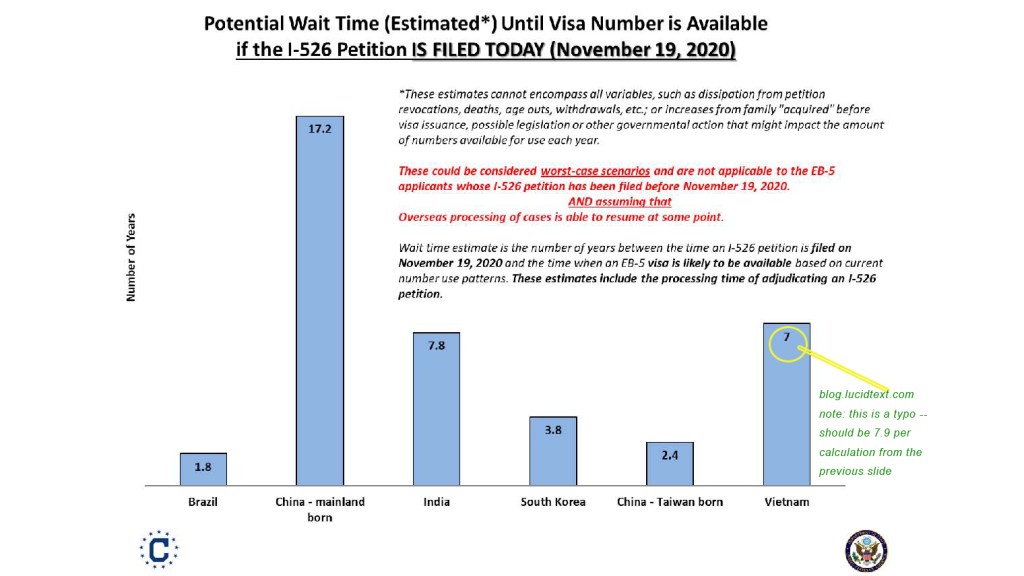
- Years to Visa Availability: The wait time estimate refers to years from the date of I-526 filing to the date of having a visa available for conditional permanent residence. The wait time estimate is a function of how many total people are in the process, regardless of where they are in the process or how long or short I-526 processing times or other processing may be. For example, 1.8 years for Brazil just means that there are enough Brazilians in the system today to claim 1.8 years of available visas. The actual visa wait time for a Brazilian filing today will likely be longer simply due to the separate factor of I-526 processing times, which have been longer than 1.8 years. For countries facing long visa availability waits regardless, I-526 processing times occur concurrently with, not consecutive to, the visa availability wait. (Though I-526 processing time can affect the visa availability wait if USCIS approves petitions out of date order.)
- Applicability: Oppenheim’s table makes a timing prediction specifically applicable to a single point in time: Estimated years to visa availability for a petition filed “today” October 1, 2020. Remember, this is a queue problem. At any given moment, the remaining wait time for each person standing in a long queue is different depending on how close or far that person is from the front of the queue. There’s no such thing as “a wait time for Vietnam,” but only “a wait time for someone from Vietnam who entered the queue at a certain time.” Oppenheim’s wait time estimate specifically applies to the very back of the queue. If you’ve already been in the queue for awhile, then your estimated wait time will be shorter than whatever’s estimated for your country in Oppenheim’s calculation for today. (We can estimate how much shorter by switching out the data in columns i and ii in the above table, replacing it with the subset of applicants who have earlier I-526 filing dates than yours.)
- Vietnam: The calculation reveals a typo on the bar chart slide. Vietnam should be 7.9 years, not 7 (consistent with the height of the bar and the assumption that Vietnam’s average visa availability assumption is the same as every other country: 700, not 800). 5,499/700=7.9, not 7.
- South Korea: I note a jump in the number of future South Korean applicants in the I-526 stage. The estimated wait to visa availability for a South Korean filing today (3.8 years) is now long enough to potentially exceed I-526 processing times. If USCIS takes less than 3 years to advance all those South Koreans to the visa stage, then someone filing I-526 today from South Korea might find himself in a South Korean crowd at the visa stage, with the Visa Bulletin then providing crowd control with final action dates. This concern does not apply to Brazil and Taiwan, where estimated visa availability waits remain well below processing times.
- China: The most controversial assumption in Oppenheim’s calculation is annual visa availability for China. Oppenheim explained that the current estimates assume about 3,000 visas for China in FY2021 and 3,500 to 4,000 visas in future years. (Thus the average 3,300 in the calculation – higher than the 3,000 used in his last wait time calculation from October 2019.) However, Oppenheim granted that China could well reach more like 7,500 visas per year — considering low incoming rest-of-the-world demand, and that country caps limit India and Vietnam to only about 700 visas each per year for the next 7-8 years. If the China wait line estimated at 56,961 could proceed at a future speed closer to 7,000/year than 3,000 per year, then the estimated time of arrival for someone now at the end of the China line could fall to almost half of the current estimate.
- Assumption about future visa applicants to result from pending I-526: The green column — DOS estimated # applicants with petition on file at USCIS –is calculated by multiplying the number of I-526 pending at USCIS by assumptions about I-526 denial rates and family size. I have reverse engineered this calculation, based on Oppenheim’s hints about his assumptions (including from a slide in the presentation that gives “average percentage of EB-5 principal investors” – meaning of all EB-5 visas issued, how many were issued to principals rather than family). I won’t add that detail to this already overlong post, but pause to note that these assumptions are also open to rethinking. The I-526-to-future-visa-applicant multiplier that Oppenheim uses for his calculation is based on historical experience, and does not look forward to future differences from potentially increased age-outs, attrition, and denial rates.
- Applicants not counted: It’s important to remember that in real life, the blue and green column in Oppenheim’s table are less than the total inventory of future EB-5 applicants. Oppenheim’s table counts inventory in two places: pending I-526 at USCIS, and recorded at the National Visa Center. Future EB-5 applicants also exist in these other places not counted in Oppenheim’s Estimated Total: applicants on pending I-485 at USCIS, and people with I-526 approval but not yet recorded at NVC due to delays in getting/submitting documents. I guess Oppenheim leaves these categories out of the calculation because pending I-485 numbers were historically small and it’s hard to count people associated with I-526 approvals who aren’t yet on file at the visa stage. But these missing categories are significant at least for India, which has a lot of people doing status adjustment in the U.S. (50%, in FY2022), and China (as evidenced by the fact that the number of Chinese applicants at NVC increased by almost 10,000 between October 2019 and October 2020—an increase that must have come out of that uncounted twilight zone between I-526 approval and visa stage, since it it’s not reflected in I-526 inventory change between October 2019 and October 2020.)
Does Charles Oppenheim overestimate or underestimate actual EB-5 wait times?
Let’s go back to our equation, A/B=C, where A is estimated number of people currently in line for a visa, and B is estimated average number of visas available per year. Oppenheim overestimates or underestimates wait time C depending on the accuracy of A and B, which contain assumptions about what will happen in the future.
As discussed above, Oppenheim’s calculation of A can be challenged by questioning his assumptions about future family size and attrition rate (which would make his A calculation err high), and/or by pointing out the missing categories of future applicants (which would make his A calculation err low). B could be an underestimate if future visa availability is greater (which will almost certainly be true for China, considering low rest-of-the-world demand, and could be true for everyone if visa reforms get enacted).
So, it’s complicated. I dream of hosting a webinar with a spreadsheet that lays out the variables and formulas, and we can play what-if games together with the numbers. What happens to the wait time estimate result if I plug in an assumed average I-526 denial rate of 70% instead of 80%? What happens if I add a guessed 10% attrition rate at the visa stage? What if I guess 10% of children per year aging out? What if I delete the family size variable from the equation entirely in case the law changes to only count investors? What if I start from I-526 filing numbers to try to quantify those uncounted categories of people who have I-526 approval but not on file at the National Visa Center? How does the calculation change if instead of picking one average number for visa availability, I look at visa availability year-by-year into the future based on what I know about how the current backlog will spread out over time? If I need my wait time to be a maximum five years, say, what combination/quantity of changes could yield that estimated result? (And how plausible do those changes look?)
Indeed, I have prepared visa timing scenario analysis, if I can manage to wrap it up in a sellable package. The alternative to such a complicated exercise over Excel is to think wishfully “Well since the wait time is complicated and questionable maybe the wait time is actually short, at least as short as I need it to be.” I’ve heard that sentence spoken in almost those words, again and again. But people with lives/business/investment dependent on actual EB-5 timing – project companies or investors – need a better sense of the probabilities. If you’ve read patiently to the end of this long and difficult post, I count you in this vigilant group, and will try to be available for additional assistance.
By the way, you can visit my Data Room page to find links to Oppenheim presentations from previous years. Or if you’d like to book a consultation with me, I will curate data for you relevant to your specific questions and concerns. I dare say that I have my fingers on every piece of quantitative information that has been published for EB-5 in the last 10 years, and most of what’s available from the past 27 years.