EB-5 family size trends
December 23, 2024 Leave a comment
In the spirit of the holidays, I’m sharing a few data-rich charts on the topic of EB-5 family sizes. How many EB-5 investors even have families, on average? It’s a critical and controversial topic, because EB-5 visa availability depends on how many visas go to spouses and children. The estimated market size for EB-5 investment can vary by a factor of three, depending on whether each EB-5 investment absorbs closer to one visa or three visas. The EB-5 backlog is either catastrophic or not-too-bad, depending on the multiplier used to convert I-526E receipt numbers to an estimated number of family vises.
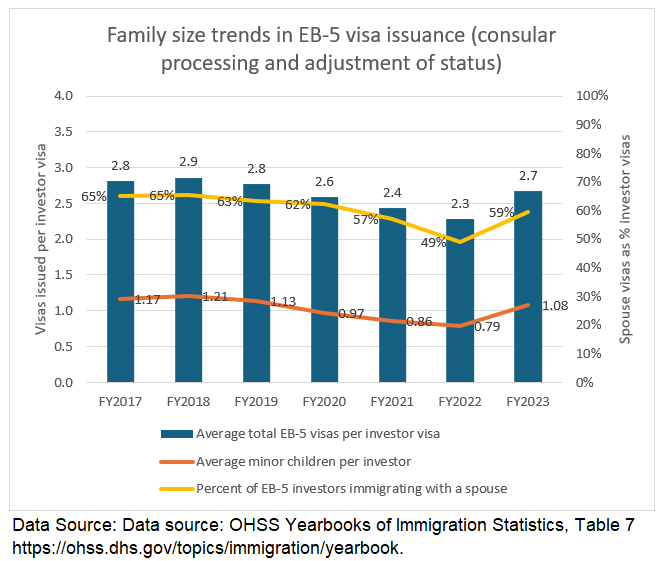
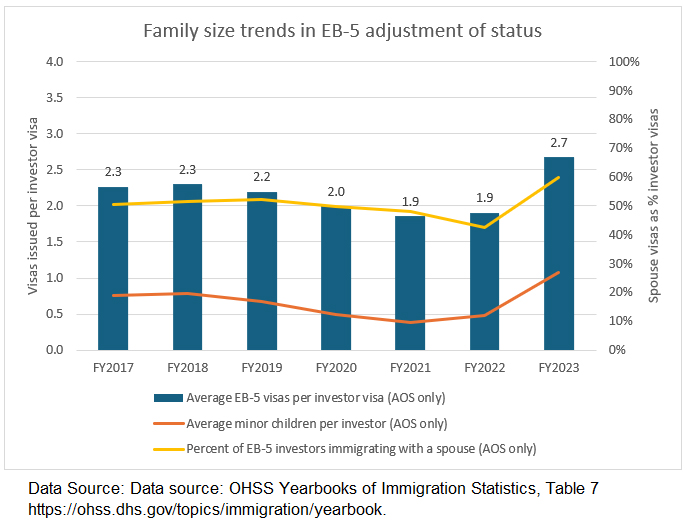
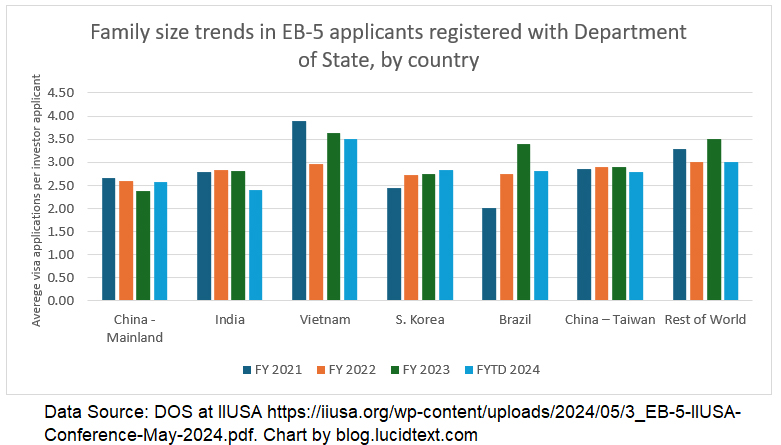
It’s dangerous to generalize from limited samples and personal experience, because EB-5 investor family size numbers have varied by country, by immigration path, and over time. Government data is available from two sources. The annual Yearbook of Immigration Statistics counts the EB-5 visas issued to principals, spouses, and children through status adjustment and to new arrivals. The Department of State periodically provides tables showing the percent of principals (investors) among EB-5 applicants registered at the National Visa Center. I made charts showing the past seven years of EB-5 data from the Yearbook of Immigration Statistics, and illustrating the most recent report from Department of State for all applicants in the NVC inventory (from Slide 6 of the May 2024 DOS IIUSA conference presentation).
The charts illustrate trends and variation, and set some guardrails. You can examine them for yourself, and draw your own conclusions. Looking at the charts, I’d say it’s clear that 1.5 is too low and 3 is too high to use as the number for average EB-5 family sizes. From 2017 to 2023, 2.6 was the average total EB-5 visas per investor visa. The seven-year average was higher for EB-5 investors abroad (2.9) than for U.S.-based investors (2.2), but the gap narrowed during the period. Maybe consular visas have steadily fallen over time due to children aging out, while adjustment visas show an upward trend as young investors start to build families. I don’t know the story behind the Pandemic-adjacent dip in people immigrating together with spouses. Looking at the country-specific differences in NVC data, we can guess about the impact of shifting the EB-5 market from one place to another.
The NVC data has the limitation of covering consular processing only, but the strength of covering the current population of applicants for future visas (including set-aside applicants with priority dates through 2024). The Yearbook data covers historical visa issuance only, but it reports on status adjustment as well as new arrivals from consular processing.
For my post-RIA EB-5 backlog estimates, I have been using 2.0 as the minimum multiplier to convert I-526 filings to estimated EB-5 visa demand. I don’t feel justified going any lower than that given the data on family sizes in the current EB-5 inventory and historical visa issuance, as detailed in the charts below. Estimated failure rates are another factor in the multiplier, but we should hesitate to count on high failure rates for Pre-RIA investors. “Don’t worry about the backlog because most of them will probably fail” is not a good sales pitch.
We should keep reminding Congress that the economic impact of EB-5 could be so much bigger, if family members didn’t get counted against the EB-5 visa limit. Does Congress realize that under current rules, fewer than 4 out of 10 of the visas designated to incentivize investment can actually go to investors?

Discover more from EB-5 Updates
Subscribe to get the latest posts sent to your email.
