EB-5 Visa Backlog and Outlook as of 2025 – UPDATE with June 2025 data
November 4, 2025 2 Comments
[3/6 UPDATE: I now have a more recent post on this topic.]
The EB-5 Backlog Analysis Excel file linked to my EB-5 Timing Page has received another significant update. I incorporated data now available through June 2025, and adjusted the analysis. As demand grows, so does the need to think creatively about timing. Is there a way to look at the EB-5 inventory numbers and conclude “relax, this is not a backlog problem?” Is it possible to calculate an attractive EB-5 visa path for investors from China and India? This is what I’m thinking as I sweat over Excel, trying to model in complications and nuances and imagine best-case scenarios for visa availability.
The Big Picture
We now know that up to June 2025, over 6,000 Rural investors and over 6,000 High Unemployment investors had started the EB-5 process. How long could it take those investors to finish getting visas, considering about 2,000 Rural and 1,000 HU visas to be shared annually by investors, spouses, and children? If 12,000+ investors become 24,000+ visa applicants going for about 3,000 annual visas, what could happen? What happens if we continue to attract 5,000 investors per year, even if all 10,000 annual EB-5 visas were available to give to new investors plus family? Can the situation be saved by one year of carryover visa issuance, by denial/attrition rates, by government reporting error, by category switching, and/or by extra visas?

The big picture problem is clear, but the details are complicated. I bother copying data into Excel and attempting models because there are a lot of moving parts and possible assumptions between what’s known about the waiting line and what we want to assess: prospective visa wait times. Below, a few comments on my recent revisions to the Excel file linked to my EB-5 Timing Page.
What Changed in the Model – Input Data
EB-5 waiting lines are changing in real time, as more people start the process daily while others move on with visas. The previous version of my Excel model was set up with projections assuming that then-unknown incoming EB-5 demand in 2025 was mirroring demand in 2024. Now with actual I-526/I-526E receipt data published through June 2025, we can start to correct that assumption. As it turns out, demand has been trending upward, with the first 9 months of 2025 already exceeding total I-526/I-526E filings in 2024. Two types of demand have particularly steep spikes this year: demand for Rural investments, and demand from India-born investors. More people getting in a line naturally lengthens expected wait times for that line over previous estimates.

And then there’s the question of queue movement: adjudication rates and visa issuance volume. When I originally set up the Excel model for backlog analysis, I didn’t account for past visa issuance because it had been so low at that point, and I optimistically assumed that Rural and High Unemployment petition approvals and visa issuance would finally reach volume in 2025. With that assumption, I assumed that 2025 carryover reserved visas would not be lost, and that country caps could shortly apply in response to high Rural and HU applicant volume. Those assumptions facilitated some simplified scenarios that I’ve now deleted from the model. Now we know that the Visa Bulletin never moved in FY2025, and that cap limits on China and India could be deferred for an extended time due to low visa issuance volume. Revising predictions in light of low backlog movement means assuming fewer total Rural and High Unemployment visas issued (worse for wait times overall), but more visas issued to China-born and India-born applicants (better for China/India wait time predictions).
What Changed in the Model – Alternate Approach
I’ve noted alternate approaches to backlog analysis: a basic approach that I’ve typically used, and the industry standard approach. The formula is the same, but the approaches solve for different variables.
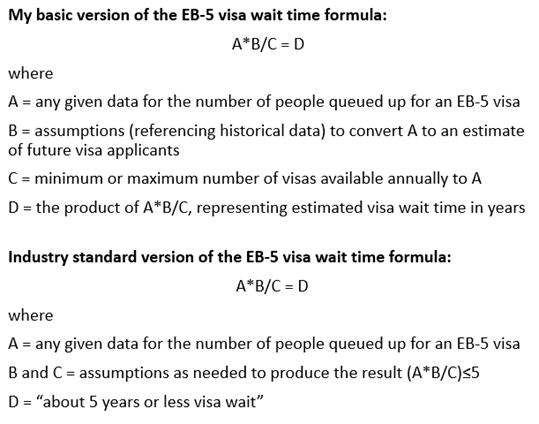
In the industry standard approach, the result – that EB-5 wait times must be tolerable (i.e. “about 5 years or less”) — is entered as a given, and then one solves for the levels of failure, attrition, double-counting, reporting error, category-switching, and/or extra visas needed to achieve that result. I tried to set up the revised model to facilitate this approach, setting up scenarios where one can assign values to a variety of assumptions to make a quantitative bridge between A (available data on people in line) and D (the conclusion of a tolerable wait time).
The industry standard approach has validity, considering that the variables don’t represent inert data points but people with limited lives and patience who are only going to hold out for a green card for as long as is tolerable/possible/feasible. When my basic approach divides 6,000+ China Rural applicants by the minimum 140 annual Rural visas certainly available to China, the result “43+” can’t mean that anyone in real life will wait 43+ years for a visa. Factors like category-switching and attrition can result in actual visa issuance above the theoretical minimum, and in actual visa applicants below baseline expectation. But let’s not wave hands vaguely in the air over the factors, asserting that variables of unspecified value will add up to a preconceived wait time conclusion. One can start with available data, assign specific values to assumptions so that they’re open to consideration/critique, and show the work that leads to the desirable visa wait time conclusion. I’ve tried to set up my Excel file to facilitate that exercise, and invite others to improve on the attempt. I will highlight two tabs in the revised Excel model: the Unreserved tab, and the 5YR Scenarios tab.
What Changed in the Model – Unreserved Tab
The Unreserved tab is set up to assess when Unreserved visas could become available to post-RIA post-2022 priority dates. This is important, because Unreserved visas are technically available to Rural and High Unemployment investors (according to the codes on I-526E approval letters), but only practically available to applicants in order by priority date. Set-aside investors from China and India, who now face long lines in Rural and High Unemployment, need to know when they could start accessing Unreserved visas as well – i.e., when the Visa Bulletin will finally finish dispensing Unreserved visas to Chinese and Indians with pre-2022 priority dates, and able start moving on to later priority dates in 2022, 2023, 2024, 2025, etc. who haven’t managed to get Rural or HU visas yet.
I expanded the Unreserved tab by copying in the very most granular reported data available for the Unreserved backlog. Then I highlighted cells for adding assumptions about denials/attrition at multiple stages, double-counting, and future visa issuance, and set up formulas to calculate the impact of the entered assumptions. Try adjusting the assumption cells, and see what assumption values are required to reach your conclusion about the remaining size of the legacy Unreserved backlog, and remaining time to clear that backlog. Then consider the plausibility of the assumption values. (To assist the plausibility test, the tab includes data on number of I-526 filed 2014-2022, and the number of EB-5/Unreserved visas issued 2015 to 2024.)
What Changed in the Model – 5YR Scenarios Tab
The 5YR Scenarios tab is another attempt to tackle a top question from Rural and High Unemployment investors from China and India: What will happen with visa issuance in the next five years, and could my turn at a set-aside visa number come in that time? On this tab I first highlighted available data related to Rural and HU supply and demand (I-526/I-526E receipt numbers and visa issuance through mid 2025), set up a section for inputting key assumptions about the future, and built a results section to automatically recalculate conclusions from the assumptions entered.
For the 5YR Scenarios tab assumptions section, I set up cells highlighting the two most significant demand factors factors that I see moving the needle on visa wait times for Rural and HU investors from China and India.
- For every one who starts the EB-5 process by filing I-526/I-526E, how many visas will actually get used? Smaller family sizes and higher failure rates mean lower visa demand and shorter queues/wait times, and vice versa. (My default assumption of average 2.0 visas per I-526/I-526E filed is based on combining the historical average 2.63 EB-5 visas issued per investor with my guess at 25% future denial/attrition rate overall. But the future reality could plausibly turn out higher or lower. The model lets you adjust these cells to match your best guess.)
- How much will investors from China and India have to compete with Rest of World demand for Rural and High Unemployment visas? Could ROW squeeze China and India down to the 7% country caps, or leave some visas unused on the table to allocate above 7%? The Rest of World prediction in the model has two parts: 1) how many ROW investors will continue to file Rural and HU I-526/I-526E on an on-going basis, and 2) how many of those investors will go on to ultimately request a Rural or HU visa rather than the Unreserved visa for which they also qualify? Less ROW visa usage would mean more visas left for cap-limited China and India applicants, and thus less-bad China/India backlogs. And vice versa. (The problem with being a cap-limited applicant is that I not only wait behind applicants with earlier priority dates, but also behind applicants who will invest later but can still have priority over me for visa issuance thanks to the country limit.) For the ROW demand/usage assumptions I entered a limited set of scenarios in the model — mainly to illustrate how much these assumptions move the needle on future backlogs/timing for China and India. For example, prospective visa availability for current China and India Rural investors increases dramatically due to decreased competition if regional center EB-5 becomes unpopular after the 2026 grandfathering deadline, and/or permanently expires after 2027. Likewise, if many existing Rest of World investors volunteer to take Unreserved visas, that means more Rural and HU visas left for post-RIA Chinese and Indian investors who face wait times in all categories. I hope that laying out some of these “what ifs” in scenarios in Excel helps to clarify these considerations. I don’t know what will happen with future EB-5 demand, but I know that whatever happens will significantly effect wait times for Chinese and Indian investors starting the process today.
There’s quite a large range of possibility for what could happen with visa demand. Less so, I think, for supply side predictions. I entered a best guess at to-date and year-by-year Rural and HU visa issuance in the 5YR Scenarios tab, and highlighted these cells as assumptions that you can change. But I can’t think of dramatically different scenarios for estimating total visa issuance by 2030. We can assume one extra helping of visas thanks to carryover, whether Department of State manages to serve that extra helping in 2026 or 2027. We might get a few visas over average one year thanks to extras from family-based, or a few visas under average one year due to consular constraints. Actual to-date visa issuance might turn out a bit higher or lower than my guess based on data through May 2025. But overall, probably not enough variation over the period to make a great difference — unless DOS continued indefinitely to issue <2000 Rural and <1000 HU visas, thus losing many visas, or unless the law changes visa availability/allocation.
The calculations on the 5YR Scenarios tab are set up to reach a conclusion for this question: how many China-born and India-born applicants with priority dates before June 2025 may not have Rural or High Unemployment visas yet by 2030? The calculation totals up demand that may be competing with these applicants (based on given data and the assumptions that you enter for attrition and ROW demand behavior), then subtracts the estimated total visas issued through 2029. The result is an estimate of the existing Rural and HU visa demand that might not be accommodated this decade by Rural and HU visas.
If you need to conclude that a five-year visa wait is still possible for recent China-born or India-born investors, then you can try adjusting assumptions on the 5YR Scenarios tab until it’s calculating 0 set-aside demand unaccommodated by set-aside visas by 2030. And/or changing assumptions on the Unreserved tab until it’s calculating 0 pre-RIA Unreserved demand well before 2030, which would mean an early date for set-aside investors from China and India to start moving over and requesting Unreserved visas. (When I enter my default assumptions, I am seeing thousands of China-born and India-born Rural and High Unemployment investors who may not be able to get Rural or HU visas this decade, or before Unreserved visas start to become available to Chinese and Indian set-aside investors. But play with the numbers and see what you think.)
Personal Note
The EB5 Backlog Analysis Excel linked to the EB-5 Timing Page is my live internal working tool for thinking about backlog questions – not a complete or comprehensive product. I share the link out of generosity and because EB-5 is full of smart people who can take the work further. Download the file, look at the data, critique the formulas, and add your improvements. Or check back in a few weeks to see what changes have occurred to me. I make frequent edits as I get new info or new ideas or notice errors. If you’d like to discuss visa availability/timing questions one-on-one, my consultation service remains available. If you find the Excel data collection and/or models useful for your own analysis, consider my Stripe or Paypal links as a way to support the effort.
Conclusion
Backing up again to the big picture: Unreserved, Rural, and High Unemployment visa applicants in the pipeline exceed forthcoming visa availability. That’s a fact under any calculation – the questions are how much excess, who’s affected, and when the excess will be felt in the Visa Bulletin. Considering the documented and growing EB-5 demand in excess of forthcoming visa supply, do we face:
- (1) discouragingly-long visa wait times, particularly for China and India, or
- (2) discouragingly-high failure/denial rates, or
- (3) rescue from Washington, D.C. in the form of visa relief?
Those are the three options. Where A*B/C=D, and A is a given number of investors/applicants queued up for visas, the wait time D isn’t coming down except by discounting demand with low success rate B or increasing C visas available. I hope that the industry is ready and able to bet on visa relief rather than applicant failure to underwrite the future. I am happy to see visa advocacy discussions in progress. CanAm highlights the issue in a new whitepaper EB-5 After the RIA (with sections by experts around the industry), and is hosting a webinar with IIUSA’s Aron Grau and Lee Li on November 18 that will address visa advocacy among other topics. And the final article in Fall 2025 IIUSA Regional Center Business Journal is “Wasted Set-Aside Visas and A Call for Urgent Action to USCIS” by Lee Li and Joey Barnett.
Discover more from EB-5 Updates
Subscribe to get the latest posts sent to your email.

Dears
last week, received the I-526 E approval notice.( form I-797C, NoA)
Indian, PD: Dec’22
RC, TEA Category
Tk u for the analysis.
Bought a cup of coffee for you.😃