Visa Usage, GAO TEA Report, RC List Updates
October 21, 2016 8 Comments
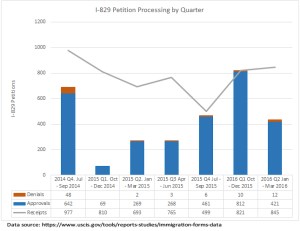
Visa Usage
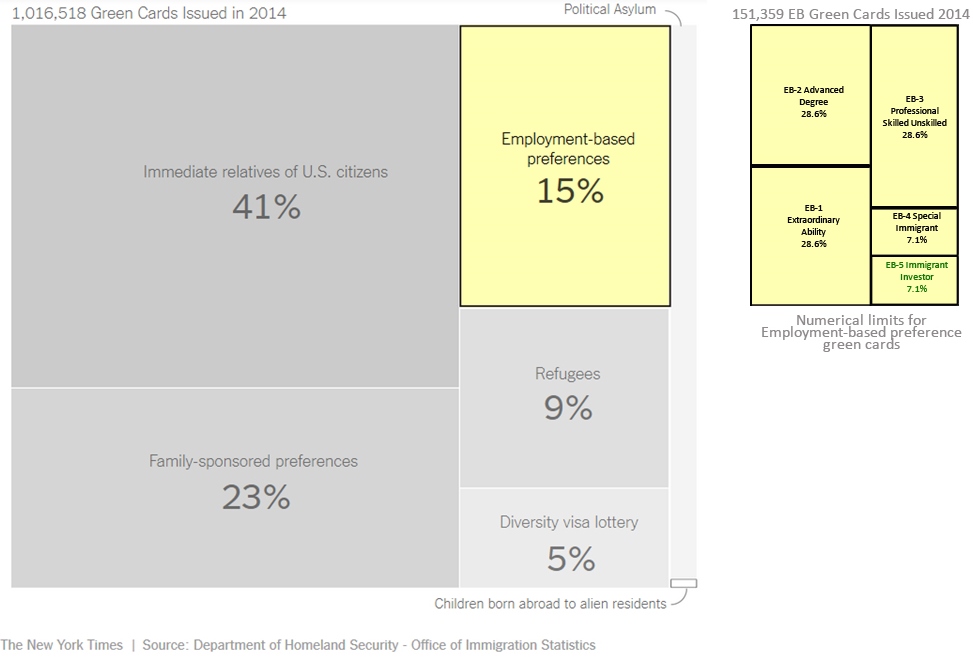
Here is a chart that visualizes how EB-5 fits into the big picture of U.S. immigration. The main chart is lifted from a New York Times article this week that discusses immigration levels. I added the box with detail on numerical limits within EB preference visas.
It’s worth gazing at this chart and considering how we feel about the allocations. The pie is unlikely to get larger: the message I hear from Washington is that no one has the political will to push for a greater total number of immigrants to the U.S. The pie could be divided differently, if Mr. Trump or Ms. Clinton gets a chance to make comprehensive immigration reform happen. EB-5 is currently limited to barely 1% of the annual total (7.1% of the EB category), and EB-5 investors get still fewer numbers since they share the allocation with family members. This wasn’t a problem for years when the program didn’t really work, but now is a shame as EB-5 is working overtime and thousands of people eager to invest in US business and bring their resources to the US are stuck in years-long waiting lines. (For sobering figures on wait times, and thoughts about how to alleviate the problem, see the slides from Symposium on EB-5 Visa Usage at the IIUSA EB-5 Industry Forum October 2016.) The employment-based category as a whole is bursting at the seams as it tries to accommodate needs from health care to Silicon Valley with only 15% of total visas, so EB-5 stakeholders aren’t the only ones agitating strongly and loudly for a better piece of the pie. As the New York Times points out, the current legal immigration system prioritizes family reunification over employment-based preferences. Mr. Trump says he wants “to choose immigrants based on merit, skill and proficiency” (so far so good for EB-5, though his idea of reducing total immigration could pull the rug from under EB-5 visa numbers), while Ms. Clinton’s immigration platform keeps the focus on families. One or the other will probably get elected next month, and we’ll wait with bated breath to see what happens next with immigration. Maybe either will solve the problem by reducing the likelihood that a million sensible people a year will even want U.S. immigrant visas. (FYI: my chart and NYT’s chart aren’t exactly in parallel, since theirs shows percentages used in a given year while mine shows numerical limits — percentages that may not match actual usage in 2014.)
GAO Report
The Government Accountability Office has another EB-5 report, this one titled Immigrant Investor Program: Proposed Project Investments in Targeted Employment Areas (September 19, 2016). The report is addressed to Senators Grassley and Leahy and Representatives Goodlatte and Conyers, and responds to their request for information on EB-5 projects in recent I-526 petitions, specifically “(1) proportion of petitioners that did or did not elect to invest in a TEA; (2) proportion of petitioners basing a high unemployment TEA on various types of geographic areas; and (3) EB-5 investment as a proportion of the total investment in petitioners’ TEA projects.” GAO answers these questions with statistics from a random sample of 200 I-526 petitions filed in FY2015 Q4. The report will interesting for people who don’t already know where most EB-5 money goes, in terms of geography and industry, and how EB-5 normally fits into a project’s capital stack. The report is a gift to journalists itching to write a headline with “gerrymandering” in the title (though it also indicates that the majority of combined-census-area TEAs are actually quite small areas, comprising fewer than 11 tracts). I’ve gathered that Grassley et. al.’s ideal EB-5 project is a business with no non-immigrant funding in a thoroughly blighted Midwestern town, and the GAO report reflects the fact that indeed few EB-5 petitioners have chosen such projects. Of course TEA incentives are only one factor in this reality. Market factors also determine the kind of project that entrepreneurs are willing to undertake and investors are willing to fund. But the GAO report will inform the talks on EB-5 legislation that need to resume before December 9.
Regional Center List Updates
Additions to the USCIS Regional Center List, 9/16/2016 to 10/03/2016:
- Eagle EB-5 Regional Center (California)
- McCormick Regional Center LLC (Washington)
- NY Entrepreneurs Fund, LLC (Connecticut, New Jersey, New York)
Restored to list of approved RCs (apparently removed by mistake last week):
- Benefield California Regional Center, LLC (California)
- HS Regional Center, LLC (California)
- SAA Cedisus EB-5 Projects – SW Indiana Regional Center, LLC (Indiana)
- Western Energy Regional Center (Oklahoma)
Renamed:
- American Islands Regional Center (former name United States Virgin Islands Regional Center) (U.S. Virgin Islands (USVI))
New Terminations:
- Northern Illinois Regional Center (Illinois) Terminated 10/16/2016
- Arizona Alternative Energy Center, LLC (Arizona) Terminated 10/6/2016
- Detroit Immigrant Investor Regional Center (Michigan) Terminated 9/30/2016
- Yellowstone Montana Regional Center, LLC (Montana) Terminated 9/28/2016