FY2015 I-526 and I-829 Statistics
November 19, 2015 Leave a comment
USCIS has published Q4 2015 processing data for I-526 and I-829 petitions on its Immigration and Citizenship Data page.
I’m copying below charts that I made from the data. For those who prefer words, here are a few points that I notice.
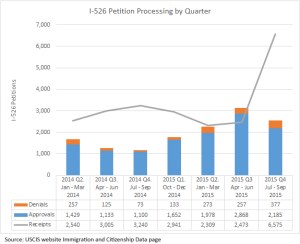
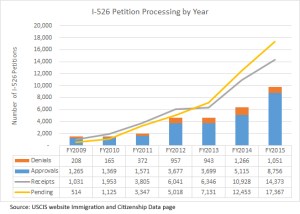
- I-526: FY2015 saw a huge number of I-526 filings – over 14,000 receipts (with 46% filed in the fourth quarter in a surge prior to possible program changes). Assuming that only about 10,000 EB-5 visas can be issued in a year, and an average of 2.2 visas per investor I-526, then this year’s receipts alone will take up over three years-worth of available EB-5 visas. FY2015 ended with over 17,000 petitions pending, which would take up nearly four years of available EB-5 visas. USCIS has shown impressive year-on-year improvements in the number of I-526 petitions processed, up 32% in 2014 and 42% in 2015. USCIS even briefly caught up to the number of receipts in Q3 2015, but then got snowed under again with the blizzard of filings in Q4 2015.
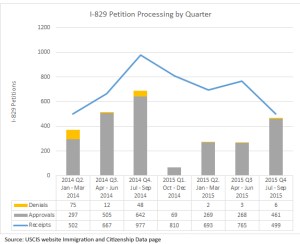
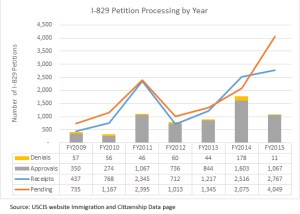
- I-829: A similar volume of I-829 petitions were filed in 2014 and 2015, but with very different distributions over the year (an increasing number of receipts by quarter in 2014 and decreasing number by quarter in 2015). Overall FY2015 had 10% fewer receipts than the previous year, but I don’t know whether to call a puzzling trend or just note seasonality. The IPO office at USCIS, which took over I-829 processing at the end of 2014, got a slow start but picked up speed and managed to process 467 I-829 petitions in Q4 2015. In all IPO processed over a thousand I-829s in FY2015, but ended the year with a backlog of over four thousand petitions. We hope that IPO picks up the pace so that the I-829 backlog alone doesn’t take four years to process.
And because it’s topical, though I doubt the significance of these averages, here’s a chart with the latest update to IPO processing times.

Discover more from EB-5 Updates
Subscribe to get the latest posts sent to your email.
