FY2018 Q3 EB-5 Form Processing Statistics
October 31, 2018 9 Comments
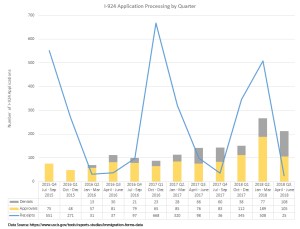
After months of famine we suddenly have a feast of EB-5 numbers: data for FY2018 EB-5 form completions through September 2018 from the USCIS/IIUSA meeting on October 5, data for pending I-526 as of October 2018 from an IPO mailbox response to my blog reader, per-country I-526 data through FY2017 on sale by IIUSA, data relevant to the EB-5 visa waiting line from a wonderful panel with Charles Oppenheim at the AILA/IIUSA conference, and now official figures from USCIS for EB-5 forms received, approved, denied, and pending in the third quarter of FY2018 (April to June 2018). I’ve already reported on the first two data sets, and will cover the Oppenheim presentation in a forthcoming post when I’ve had time to process the information. As time permits, I may also do a post that tries to make sense of how these various data sets intersect, and some apparent contradictions and mysterious gaps. But for now, here are my charts highlighting trends in the official FY2018 Q3 data. The numbers come from the USCIS Immigration and Citizenship Data page, with Form I-526 and I-829 data in the Employment Based subsection, and Form I-924 data in the Forms subsection in the “All Forms Report.”
A few notes:
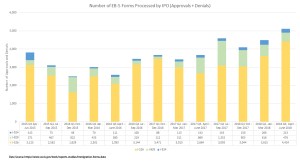
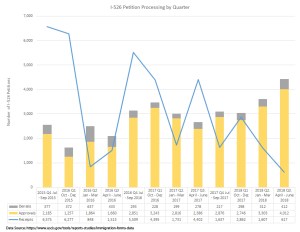
- Overall, IPO is receiving fewer forms and processing more forms than before. That should be a good sign for processing times at least, and will result in smaller backlogs. However, performance improvement is currently all focused on I-526. Q3 showed a record-breaking number of I-526 processed (22% improvement over the previous quarter) but drop in number of I-924 and I-829 processed.
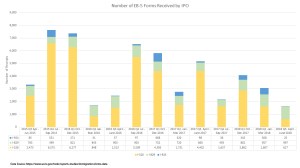
- Q3 I-526 receipts were lower than any quarter I’ve recorded since 2013, likely reflecting concerns about visa wait time.
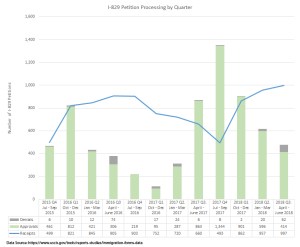
- In Q3, I-829 receipts exceeded I-526 receipts for possibly the first time ever.
- I-829 completion rates look terrible, with an almost-linear 65% drop in completions over the last four quarters. What’s happening, I-829 team? Why are you getting fewer and fewer I-829 adjudicated? IPO should put more resources on I-829 adjudication, considering the receipt trend across all forms.
- A surprising 51% of Form I-924 adjudicated in Q3 were denied. The denial rate for I-829 was higher than usual, at 13%. The I-526 denial rate remained at 9%.
- USCIS is not infallible when it comes to inconsistencies, and the Q3 reports contain significant revisions to the Q2 and Q1 numbers previously reported. In the I-829 reports, for example, the May report indicated 1,046 receipts in Q1, the July report indicated 694 receipts in Q1, and now the October report indicates 862 receipts in Q1. You make us doubt that you know what happened in with I-829 in Q1, USCIS! This should make USCIS recognize and sympathize with the difficulty of reporting consistent numbers, even with the best of intentions. FYI, here is my file on the ongoing mystery of the pending petition count.
Discover more from EB-5 Updates
Subscribe to get the latest posts sent to your email.

Quoted in the The Real Deal… https://therealdeal.com/2018/11/01/eb-5-immigrant-petitions-are-at-lowest-rate-in-at-least-five-years/
Suzanne, did the USCIS disclose any new info at the conference in Chicago? Thanks again.
USCIS did not say anything new to me. The best presentation was from DOS, which I’ll write about this weekend. IIUSA just posted the slides here: https://iiusa.org/blog/wp-content/uploads/2018/11/EB-5-AILA.IIUSA-Visa-numbers-panel-for-EB-5-Conference-October-2018.pdf
Thank you
Suzanne, when you have time, could you kindly update your I-526 Time spreadsheet by adding the Q3 data? Thank you.
ah yes, another item for my to-do list. Also, I wish USCIS would update their processing time info! They haven’t touched the I-526 calculation since August
Ok, now it’s updated.
I guess USCIS has published pending I-526. Here is the link from other site http://discuss.ilw.com/articles/news/389725-news-uscis-publishes-pending-i-526-data-showing-india-in-the-number-one-position-almost-double-of-china-and-vietnam
FYI..
This was published back in October. I first wrote about it here. https://blog.lucidtext.com/2018/10/25/pending-i-526-by-country-as-of-10-2018/ And here is the link directly to the USCIS website: https://www.uscis.gov/sites/default/files/USCIS/Working%20in%20the%20US/i526list.pdf