October 2019 Oppenheim EB-5 wait time estimates
November 13, 2019 11 Comments
Department of State Visa Control Office Chief Charles Oppenheim presented about EB-5 visa availability at the IIUSA conference on October 29, 2019. Here are his presentation slides and my recording. (Update: Lee Li of IIUSA has written a helpful slide-by-slide commentary on Oppenheim’s presentation in his article Data Analysis on Fiscal Year 2019 EB-5 Visa Number Usage & Estimated Visa Waiting Lines.)
The October 2019 presentation suggested encouraging headlines: shorter wait times and faster-moving visa bulletin dates than previously predicted. Behind the headlines lies a vexed story that I shall tackle in this difficult post.
Post Agenda:
- Put Oppenheim’s October 2019 EB-5 timing estimate in context of past estimates
- Discuss how to read the “EB-5 Applicants with Petitions on file at NVC and Estimated USCIS Applicant Data” slide in Oppenheim’s presentations
- Review the factors that can cause the EB-5 backlog to grow and shrink
- Collect available data relevant to interpreting Oppenheim’s estimates for China, Vietnam, and India
- Interpret Oppenheim’s estimates for India
- Discuss how backlog data relates to estimated Visa Bulletin final action dates
1. October 2019 Presentation in Context
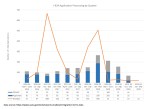
Oppenheim estimates total EB-5 backlog size (actual applicants at the National Visa Center plus estimated applicants associated with pending I-526) and then calculates wait times as a function of backlog divided by annual visas available. The following table compares key results from Oppenheim’s October 2019 presentation with previous presentations on October 30, 2018 and May 6, 2019.
| Summary of Oppenheim Estimates 10/2018 to 10/2019 | |||
| Potential year wait to visa availability if I-526 filed “today” | October 30, 2018 Presentation | May 6, 2019 Presentation | October 29, 2018 Presentation |
| Brazil | 1.5 | 1.6 | 1.4 |
| China mainland | 14 | 16.5 | 16.2 |
| India | 5.7 | 8.4 | 6.7 |
| South Korea | 2.2 | 2.4 | 3 |
| China Taiwan | 1.7 | 2 | 1.9 |
| Vietnam | 7.2 | 7.6 | 7.1 |
| Backlog size (total applicants) as of… | October 1, 2018 | April 1, 2019 | October 1, 2019 |
| Brazil | 1,010 | 1,114 | 977 |
| China mainland | 52,828 | 49,537 | 48,589 |
| India | 4,014 | 5,851 | 4,707 |
| South Korea | 1,513 | 1,676 | 2,121 |
| China Taiwan | 1,162 | 1,386 | 1,342 |
| Vietnam | 5,008 | 5,269 | 4,971 |
| Worldwide Total | 69,060 | 73,157 | 70,198 |
Note that Oppenheim’s backlog and wait time estimates fell between May and October this year for all countries except South Korea, with particularly significant reduction in the wait time estimate for India. I didn’t expect that, considering reports of a flood of I-526 filings ahead of the November 21 regulations deadline. What’s the story? Are there indeed fewer people in line for an EB-5 visa now than there were back in May, or has there been a change or omission in Oppenheim’s calculation? If fewer people in line, how did that happen? If a change or omission in the calculation, what is it, and should that cause us to rethink Oppenheim’s past or current wait time estimates? Read on…
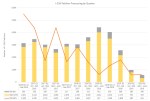
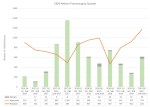
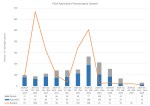
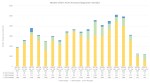
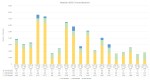
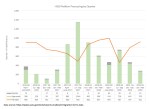
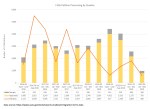
Interpreting the “EB-5 Applicants with Petitions on file at NVC and Estimated USCIS Applicant Data” slide
The data quoted above comes from this key slide, a version of which is included in each of Oppenheim’s IIUSA presentations since 2018.

This slide is important because Oppenheim’s wait time estimates are calculated from the orange column. For example 977/700=1.4 year estimated wait for Brazil. 4,707/700=6.7 year estimated wait for India. The calculations assume average 700 visas available per year under the country cap, though the total can vary by year. The denominator for China is less predictable. Oppenheim estimated a 16.2-year wait for China in October 2019, which means that he must have been assuming 48,589/16.2 = 3,000 annual visas available on average to China going forward. (Aside: Oppenheim did not explain why he chose the 3,000-visa assumption for China. China received 4,326 visas in FY2019, and Oppenheim estimates that 5,270 visas will be available to China in FY2020. Average visas available to China going forward will only average as low as 3,000 if rest-of-the-world demand continues to rise going forward, which seems unlikely considering impending investment amount increases. Note also that the wait time estimates should have been tagged for petitions filed as of October 1, 2019–since that’s the date of the data upon which they are based–not for petitions filed as of October 29, 2019. Considering the likelihood of a filing surge in October 2019, this distinction could be significant.)
In his October 2019 presentation, and in follow-up discussion in person, Oppenheim clarified these points about how to read the EB-5 Applicants slide:
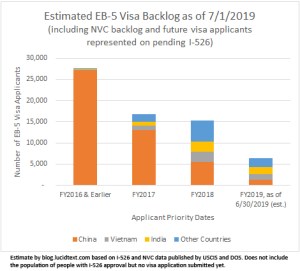
- The “Actual Number of Applicants at NVC” column is just what it says: an accounting of the actual applicants with petitions on file at the National Visa Center as of October 1, 2019. This column does not include people who have I-526 approval but without active petitions on file at NVC for one reason or another. It does not include applicants currently seeking a visa through adjustment of status with USCIS. The column includes no assumption about the number of actual applicants at NVC who may eventually get denied. The NVC column is most significant to Oppenheim’s visa bulletin calculations, because it indicates how many people are ready to claim a visa. (The I-526 column estimates potential future demand. But no one in that column is currently qualified to claim a visa, and Oppenheim does not know for sure when and if those potential applicants will emerge from the I-526 process and become qualified.)
- “DoS ESTIMATED Number of Applicants with Petitions on File at USCIS” refers specifically to I-526 petitions, and does not include I-485 petitions. This column estimates the future visa applicants associated with pending I-526 using this formula: actual I-526 pending at USCIS * assumption about approval rate for these I-526 * assumption about average visas per approved I-526. The pending I-526 data and approval rate assumption come from USCIS. The visas-to-I-526 assumption uses the “average percentage of EB-5 principal investors” Department of State data point that divides EB-5 visas issued to investors by total EB-5 visas issued to investors plus family. Oppenheim could not disclose the specific numbers used to calculate this column for October 2019. I’m particularly sad that he couldn’t disclose what USCIS told him about pending I-526 by country. He did volunteer that the I-526 approval rate assumption in the 10/2019 DoS estimate is the same for all countries, and lower than the approval rate assumption used for previous estimates. He further indicated that the “percentage of principals” assumption in the 10/2019 DoS estimate varies by country, is based on averages for visas issued in FY2019 and FY2018.
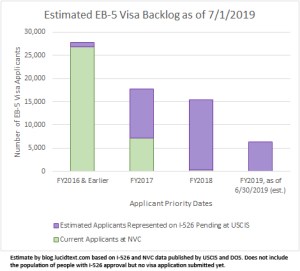
- “Estimated Grand Total” equals the blue column plus the green column. Oppenheim has not been counting I-485 applicants anywhere in the table because historically a small percentage of EB-5 visas have gone through adjustment of status. He agreed that it would be a good idea to count pending I-485 applicants in future backlog estimates. (Another hint that the “Estimated Grand Total” might be missing something: Oppenheim estimates about 48,600 total applicants for China. This seems unexpectedly low considering that at least 35,500 Chinese filed I-526 since the start of FY2015, per USCIS data, and few of those Chinese could’ve received visas yet considering that the visa bulletin still has a November 1, 2014 final action date for China. So either the China backlog has in fact experienced major attrition along the way — plausible, considering sentiment among past Chinese investors — or some category of Chinese who still could apply for a visa are not being counted in the NVC or I-526 columns.)
Potential Factors in Backlog Total Change
The size of the EB-5 backlog is constantly changing, as people enter the line by filing I-526 and bringing family, and leave it by losing eligibility or receiving visas. To review specific factors that can cause change over time to the numbers in Oppenheim’s backlog calculations, and/or the actual backlog:
Number of “Actual Number of Applicants at NVC”
- Decreased by applicants receiving visas
- Decreased by applicants being denied visas or losing eligibility (e.g. aging out, I-526 revoked)
- Decreased by applicants abandoning their petitions (need to contact NVC annually to avoid this)
- Increased by more investors receiving I-526 approval and filing visa applications (thus moving from the green column to the blue column)
“DoS ESTIMATED Number of Applicants with Petition on File at USCIS”
- Increased by I-526 filings
- Decreased by I-526 approvals and denials
- Increased or decreased by changes to the DoS assumption about number of pending I-526 that will be approved
- Increased or decreased by changes to the DoS assumption about how many family members will be associated with each principal applicant
“Estimated Grand Total”
- Increases if increases from incoming I-526 filings plus approval rate and family member assumptions exceed decreases from outgoing applicants who received visas or lost eligibility.
- Decreases if the opposite data and assumptions prevail.
- Could increase if Oppenheim started to count populations not included in the “Actual at NVC” and “Pending at USCIS” columns. This includes EB-5 applicants on pending I-485, and possibly other people with potential eligibility (I-526 approval) who do not currently have active petitions at NVC.
Data
Here is my spreadsheet that collects data particularly relevant to questions about Oppenheim’s wait time estimates in 2018 and 2019 – basically, available data related to the above bullet points. I gaze at and play with these numbers as I to try to back calculate Oppenheim’s estimates, answer questions, and interpret a story. I’m not showing my messy calculations, but present the inputs for the convenience of others working with the similar questions. Curating this spreadsheet was not easy.
Example Interpretation and Application
Take India as an example of the challenge to interpret Oppenheim’s estimates.
Oppenheim’s estimated India wait time fell by 1.7 years between April 1, 2019 and October 1, 2019 because Oppenheim estimated that the India backlog fell by 1,078 applicants during that period — Q3 and Q4 of FY2019. This backlog reduction is the net of 66 additional applicants at NVC and 1,144 fewer estimated applicants associated with pending I-526.
DOS issued 252 visas to Indians in Q3-Q4 of FY2019. (We don’t know how many visa applications were denied.) 252+66=318, so apparently the 1,144+ applicants who left the I-526 column between May and October did not all transfer over to the NVC column.
It could be that many applicants were indeed approved out of the I-526 column but then disappeared into uncounted categories—ie the pending I-485 pool and the still-preparing-a-visa-application pool. If that were true, then those people are out of Oppenheim’s calculation but not out of the queue in reality. In that case Oppenheim’s latest wait time would be an underestimate.
Or, maybe few applicants were actually approved out of the I-526 column, but the I-526 column slimmed nevertheless thanks to downgraded assumptions about I-526 approval rates and family size. Oppenheim confirmed in follow-up conversation that he did indeed change assumptions about future approval rates (significantly) and family sizes (insignificantly) for the October 2019 calculation. If I-526 receipts and adjudications were about equal in Q4 (as they were in Q3), then a changed visas-per-pending-I-526 assumption could explain the entire 20% change in estimated applicants associated with India I-526. If I-526 receipts in fact exceeded adjudications in Q4 – as I would’ve thought considering the expected pre-regs filing surge and continually lengthening processing times reports – then the visas-per-pending-I-526 assumption must have fallen by even more than 20%. If Oppenheim’s revised visas-to-investor assumptions are more accurate than his previous assumptions, then the wait time estimates from May 2019 and October 2018 were overestimates. If not, the October 2019 estimate is an underestimate.
Oppenheim’s backlog estimate does not count applicants on pending I-485. In FY2018, consular processing accounted for over 90% of visas issued to China and Vietnam, and 67% of visas issued to Indians, according to the Annual Report of the Visa Office. If there continue to be a significant number of Indian EB-5 applicants on I-485, then Oppenheim is undercounting the India backlog. For China and Vietnam, it appears relatively safe to only look at NVC numbers.
Oppenheim’s backlog estimate does not make an assumption about the number of applicants pending at NVC who will not end up claiming visas. However, this factor might be significant in reality, as suggested by Oppenheim’s commentary on the visa bulletin. The India final action date jumped in August and September 2019 thanks to an unexpectedly large return of visa numbers. Those returned numbers represent people who had been at the head of the NVC queue but then were denied at the visa interview, or missed the interview. Their disappearance resulted in visas that had been marked out for them returning to NVC and becoming available to people who had expected a longer wait time.
Overall, contemplating the numbers for India, I conjecture:
- That there can’t after all have been much of an Indian I-526 filing surge at least up to September 30, 2019 (Indeed, only South Korea clearly experienced a major filing surge in FY2019 Q4)
- That Oppenheim must now be estimating an I-526 approval rate well under 75%
- That a relatively low approval rate going forward is plausible, given trends at USCIS, and would mean that previous wait time estimates assuming higher future approval rates were overestimates
- That the current India wait time estimate is likely still an underestimate because it does not count I-485
But such conjectures are exhausting and unsatisfying. I’ve temporarily suspended my EB-5 timing estimate service, because it’s so tedious to try to navigate and quantify all the “if/thens.” And then any estimate must be so laboriously and frustratingly qualified. Until now, I have generally used Oppenheim’s point-in-time estimates as anchors for priority-date-specific timing estimates. But that doesn’t work as well when Oppenheim’s assumptions change between the points in unknown ways. When USCIS finally publishes I-526 data for FY2019 Q4 (and even better, FY2020 Q1), we’ll at least have a few more facts to anchor estimates and to help interpret Oppenheim’s estimates. And please please please USCIS, why can’t you continue to publish data on pending I-526 by country and month of priority date? This is so important to program integrity, and not justifiable as a state secret.
Backlog Estimates and the Visa Bulletin
Oppenheim’s IIUSA presentation gave predictions for Visa Bulletin final action dates.
| Oppenheim Final Action Date Predictions on October 29, 2019 | ||
| December 2019 Visa Bulletin | October 2020 Visa Bulletin Prediction | |
| China Mainland | November 15, 2014 | Best case: March 8, 2015Worst case: February 15, 2015 |
| India | January 1, 2018 | Best case: currentWorst case: November 2017 |
| Vietnam | December 1, 2016 | Best case: June 1, 2017Worst case: April 1, 2017 |
Again, the India case is a challenge. How could the October 2020 Visa Bulletin possibly become “current” for India in one year (meaning visas available to qualified applicants for all priority dates) if Oppenheim doesn’t expect October 2019 priority dates to have visas available for another 6+ years? This becomes possible if the pool of qualified applicants remains small despite the large total backlog. In other words, if most of the 6+-year India backlog remains bogged down in slow I-526 processing, and thus unable to claim available visas. Oppenheim apparently foresees that Department of State could find itself in October 2020 with 700 visas to give India and well under 700 Indian applicants pending at NVC. That could happen if USCIS keeps up its low volume of approvals. This situation is less likely for Vietnam and China, because there are already significant NVC backlogs for those countries from back when USCIS adjudicated more petitions.
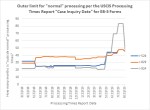
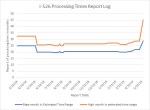
Among the many bad consequences of slow and chaotic I-526 processing: it devalues priority dates. In December 2019, Department of State offers visas to Indians with priority dates up to January 1, 1018, according to the visa bulletin. Meanwhile, USCIS is processing investor petitions filed 29 to 50 months ago, according to its processing times report. That means that Indians with late 2017 priority dates can be claiming visas now, ahead of Indians with 2015, 2016, and 2017 priority dates who are still stuck in I-526 processing. Obviously, the backlog is not moving in order by priority date. In a queue system, a person’s wait time should be a function of the number of other people already in line at the time he or she entered the queue. That would allow for fairness and predictability. But the EB-5 queue is falling into disorder thanks to the two-step process. When USCIS is slow to adjudicate I-526 petitions, and apparently advances them out of date order, then priority dates lose their predictive value. It’s not fair that an Indian with a November 2017 priority date can claim a visa today, while an Indian with a November 2015 priority date isn’t even outside of normal I-526 processing times according to USCIS. It’s not fair when wait time estimates have to ask not only “how many people were in line before me” but “how many people will be able cut in line before me thanks to disordered USCIS processing?” But that’s the fact that we face today, thanks to USCIS processing failures.
Ironically, the “best case” scenario for the October 2020 visa bulletin assumes a worst case scenario for I-526 processing. If USCIS speeds up after all, approving more I-526 and thus advancing more applicants to the visa stage, than future visa bulletin final action dates will move further back.