Major Data Update (FY2024 Visa Report, FY2025 Q2 data, FY2025 I-485 and visa progress, visa interview timing)
July 9, 2025 8 Comments
It’s time to feast after a famine of EB-5 data. We finally have the Report of the Visa Office 2024 (though not the NVC Waiting list yet), monthly immigrant visa issuance numbers through May 2025, the monthly pending I-485 report to April 2025, and EB-5 form receipt and processing data through FY2025 Q2 (January to March 2025). Before copying summary charts, I’ll start with lessons I take from the data updates for pre-RIA investors, post-RIA investors, and regional centers.
Data Insights for Pre-RIA EB-5 Investors
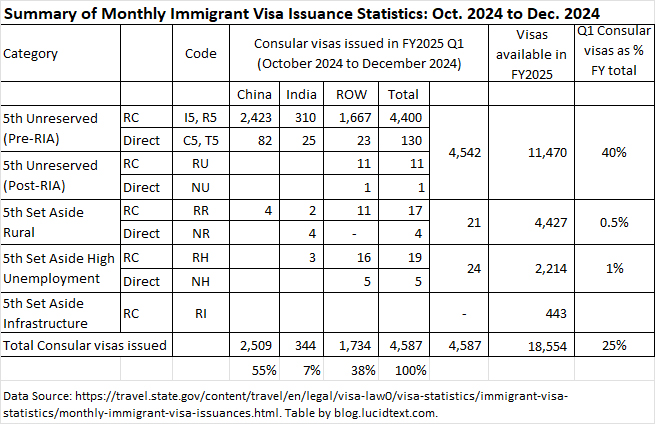
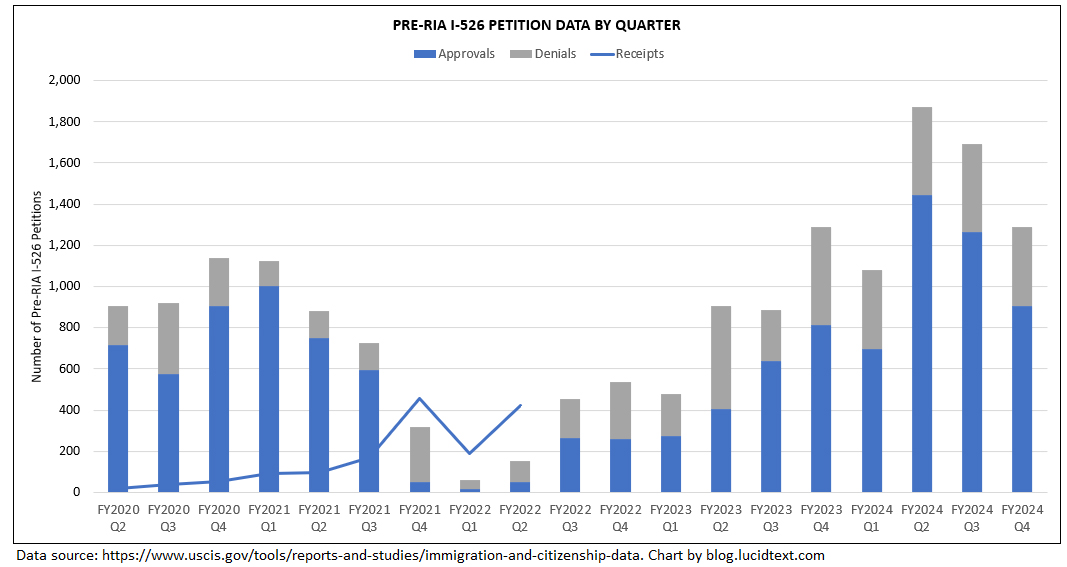
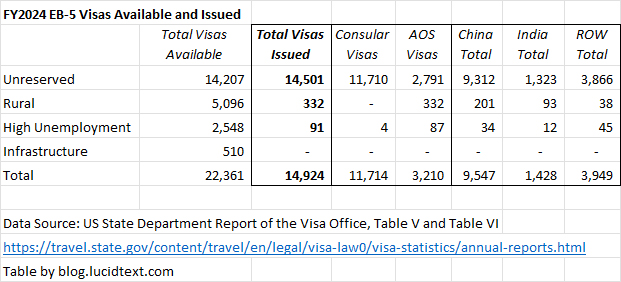
Department of State issued a record 14,501 Unreserved EB-5 visas in FY2024 — even more than technically available under the quota. China, India, and Vietnam did especially well. Vietnam cleared its legacy NVC waitlist with 1,522 Unreserved visas issued, India got 1,323 Unreserved visas (within 7% of the total EB-5 visas theoretically available to India, considering set-asides, but 9% of Unreserved), and China cleaned up with 9,312 Unreserved visas — 64% of visas issued in FY2024. (A few Unreserved visas even got allocated to post-RIA Chinese and Indian applicants — can anyone explain?) Other countries fell behind. Of “other” country EB-5 applicants who were registered at the National Visa Center in November 2023, only 38% got visas in FY2024. The other 62% were not constrained by any cap or quota limit, but by DOS capacity to schedule interviews and USCIS ability to complete I-485.
The answer to the question “who gets a visa” doesn’t only depend on priority date and country limits, but also depends on country-specific processing capacity. I’d like to highlight a helpful new page on the DOS website: IV Scheduling Status Tool. The page explains the visa interview process and factors, and gives timing by post. Post-specific timing differences for immigrant visas generally help explain the differences we see in EB-5 visa issuance. For example, the tool shows that NVC is currently scheduling documentarily complete IV cases with visas available from February 2025 in Ho Chi Minh City, but from March 2023 in Lagos. The page itemizes factors that can affect visa interview times by post, including interview capacity of the embassy or consulate, local conditions that affect operations, staffing levels, volume of cases, and vetting timelines.
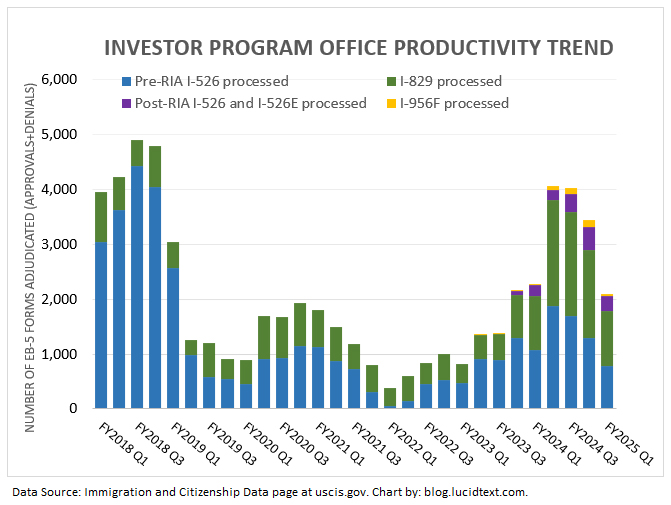
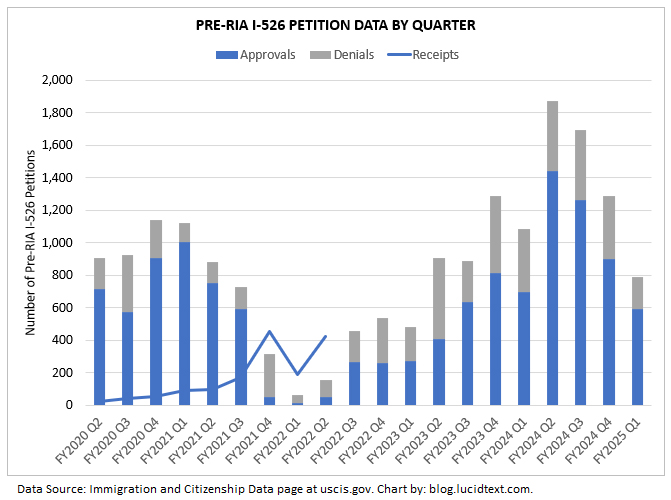
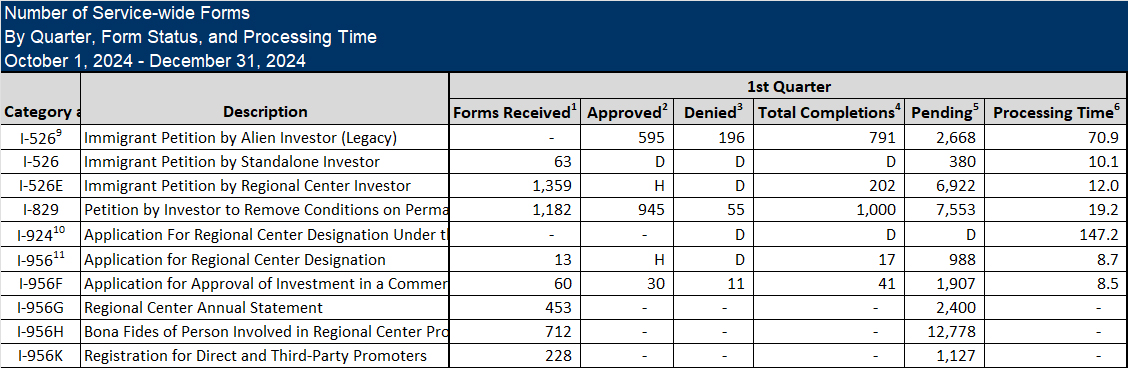
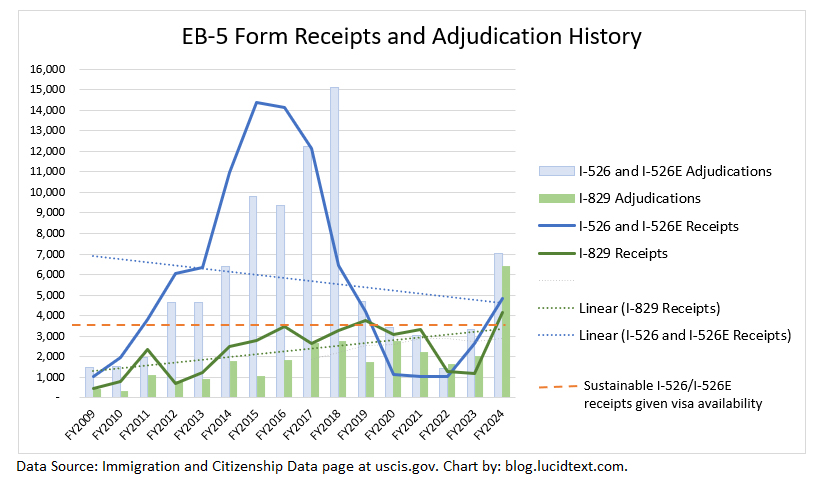
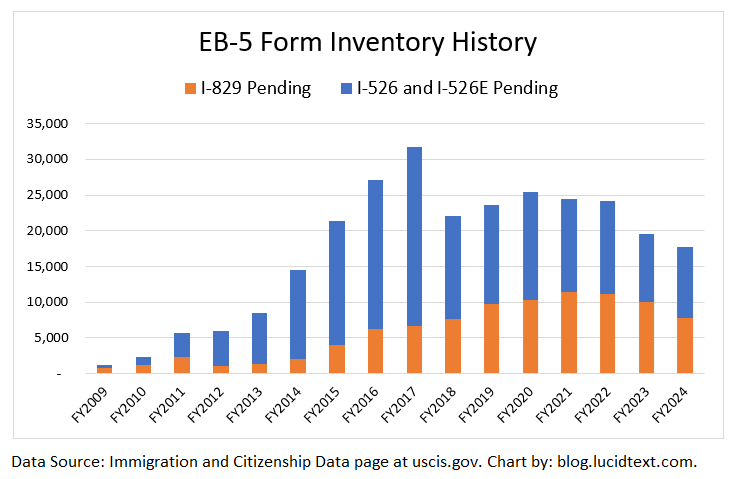
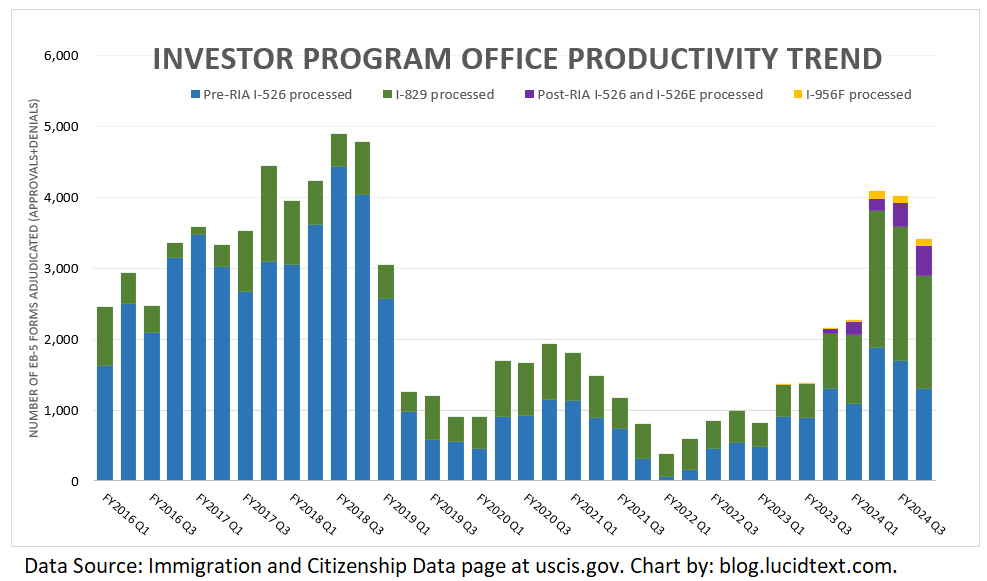
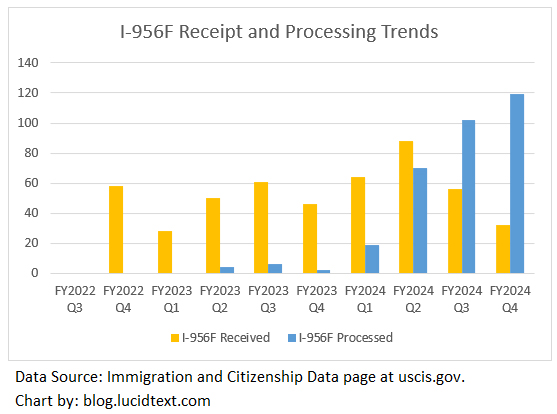
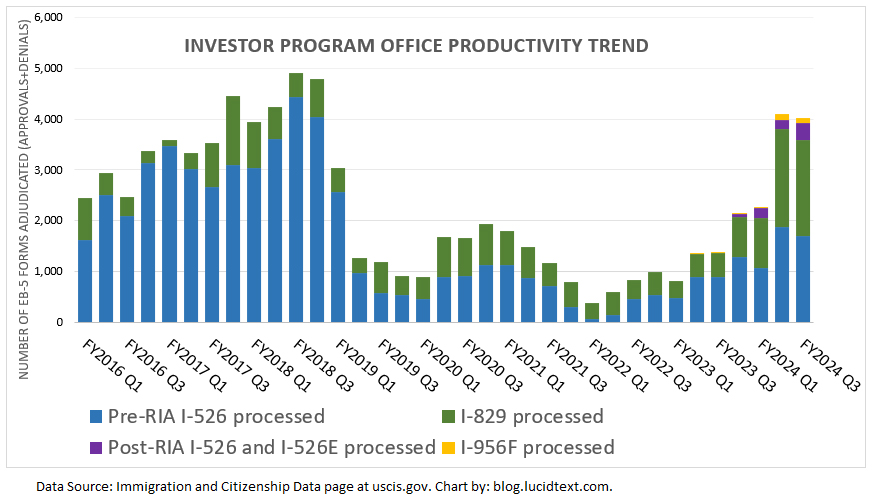
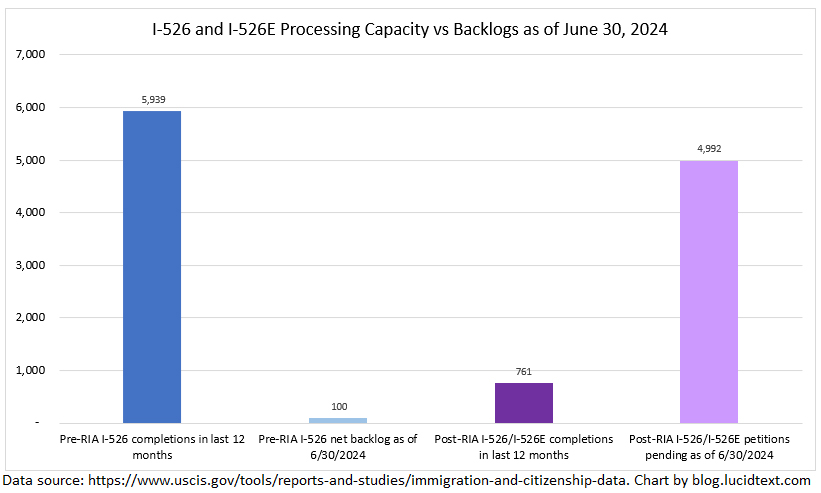
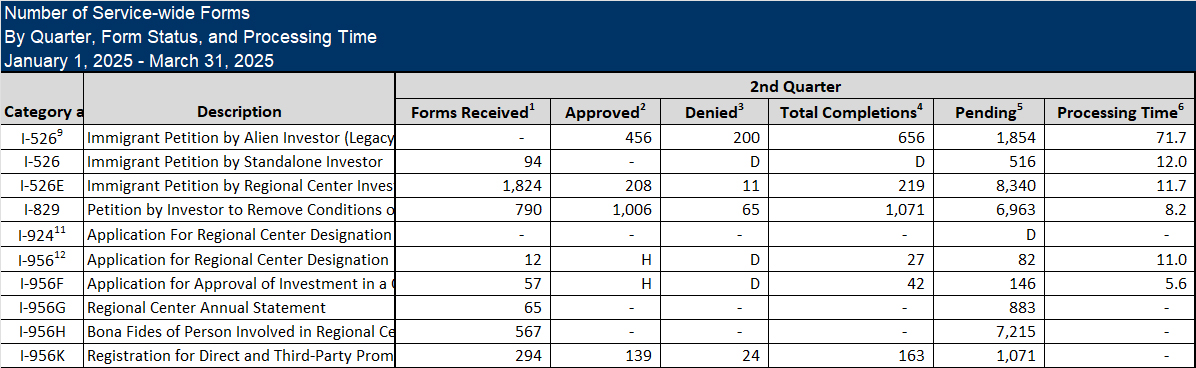
Meanwhile at USCIS, the legacy I-526 backlog continues to shrink — but slowly. Fewer than 2,000 I-526 remain pending (and only 300 unassigned), but processing volume dropped from nearly 2,000 in Q2 2024 to only 656 in Q2 2025. Denial rates for old I-526 remain relatively high – 30% in Q2.
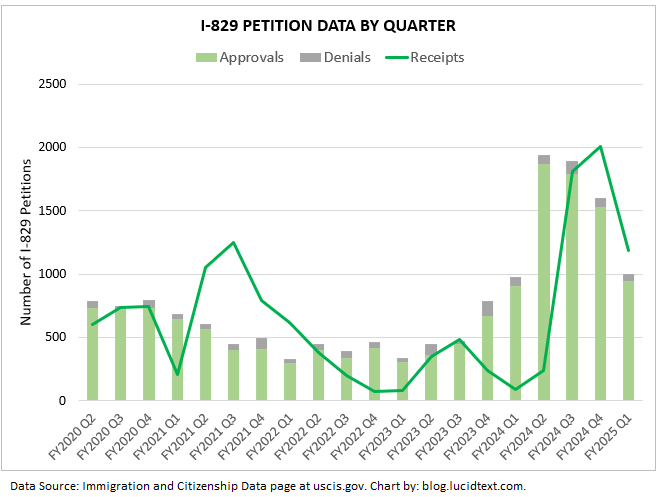
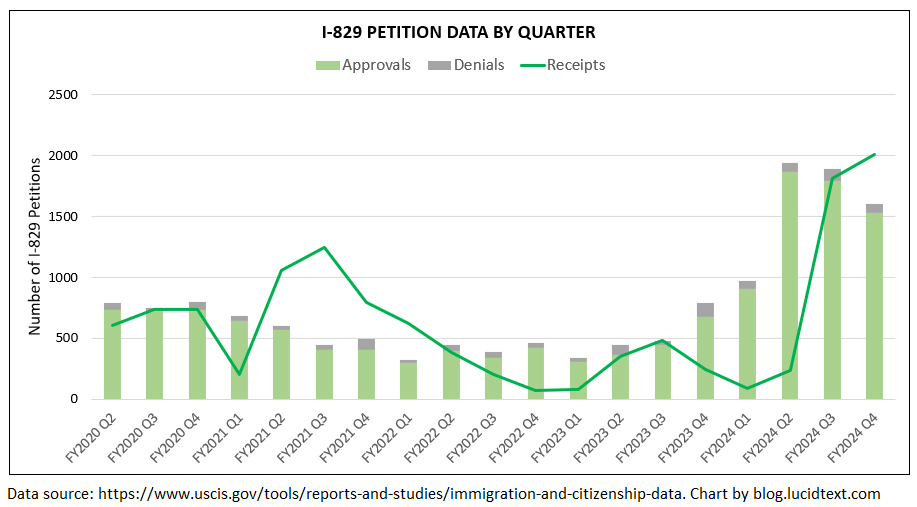
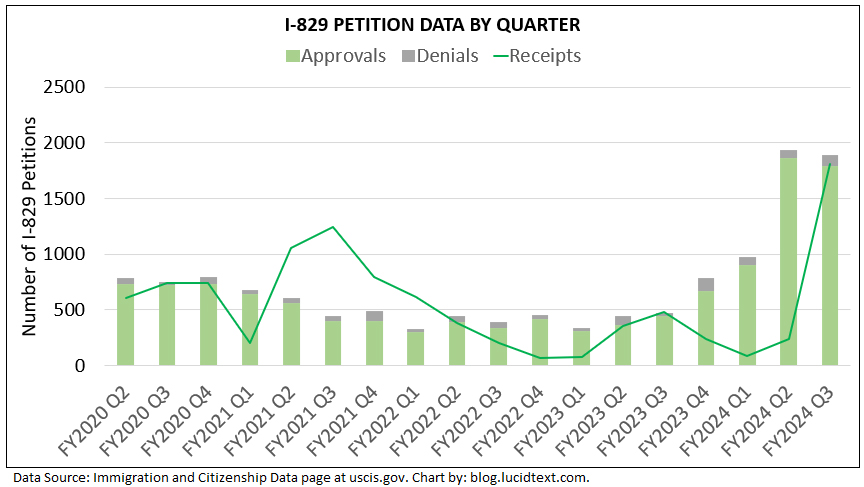
I-829 processing volumes in FY2025 Q2 were half what they were this time last year, and not FIFO. The FY2025 Q2 report shows about 1,000 I-829 processed, nearly 7,000 left pending, and a median processing time for completed I-829 of only 8.2 months. This tells me that Mandamus actions are having an impact, causing USCIS to pick out and adjudicate many recently-filed I-829 even as many older cases remain pending.
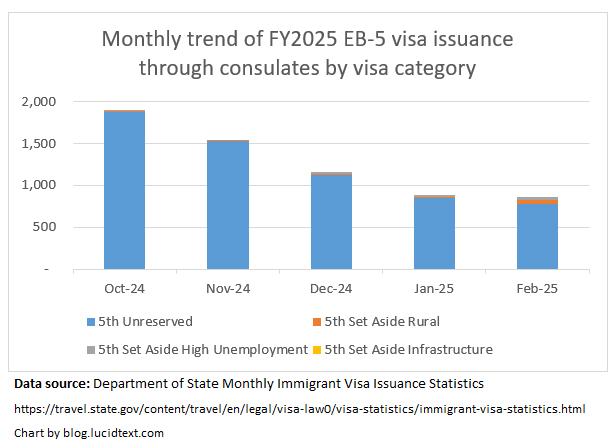
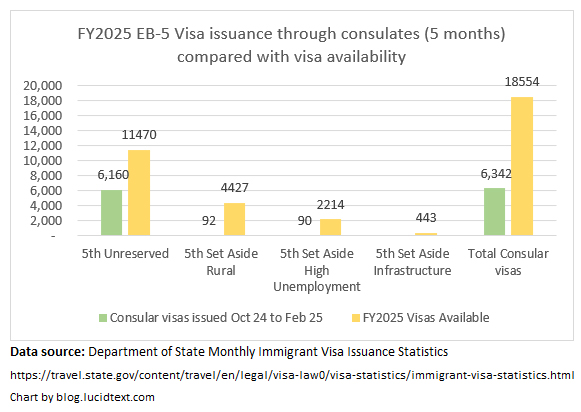
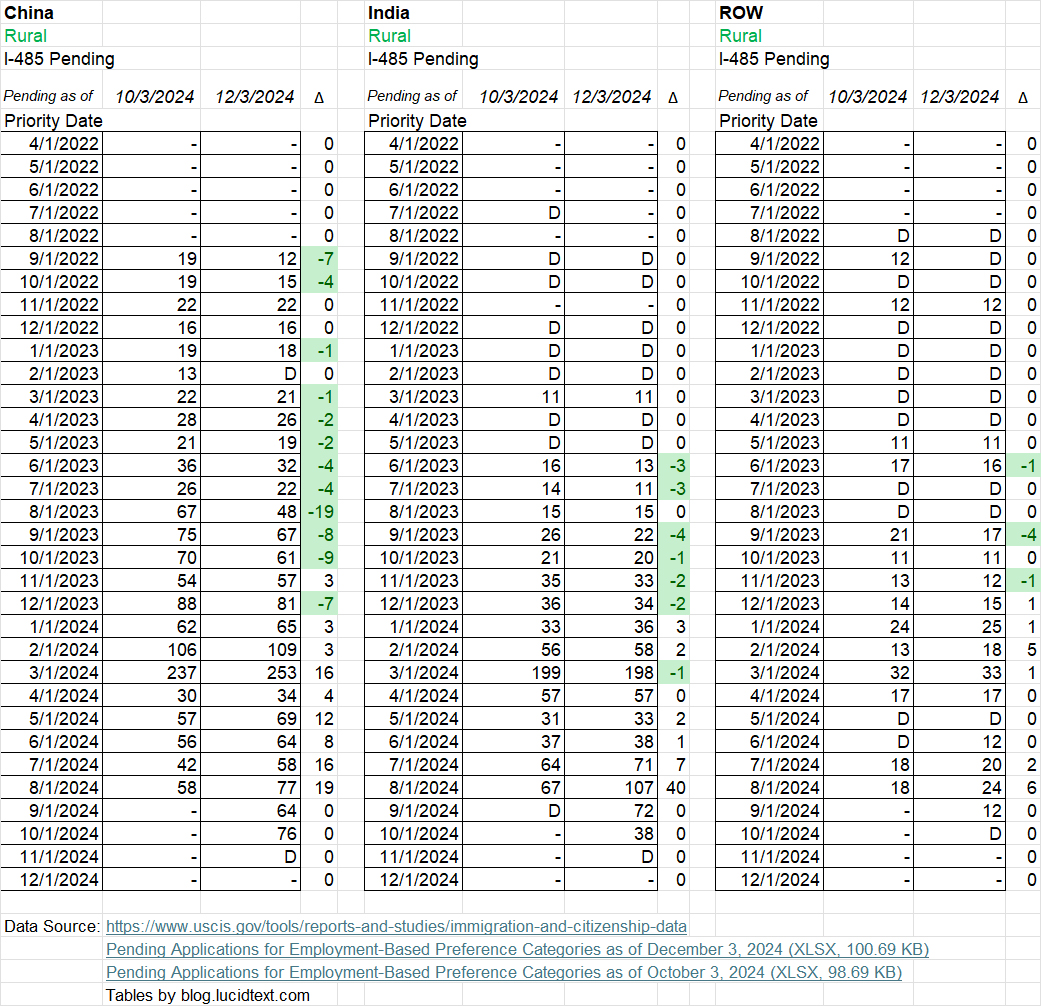
FY2025 remains on track to issue all available Unreserved visas. ROW should have a good chance at more visas since the Visa Bulletin retrogressed for China in April and India in May. (However, as of May 2025 the effect was to lower visa issuance for China and India without increasing ROW visa issuance.)
Data Insights for Post-RIA EB-5 Investors
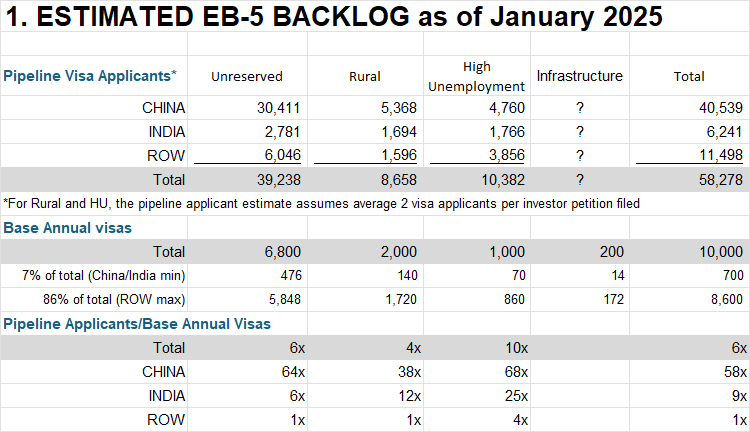
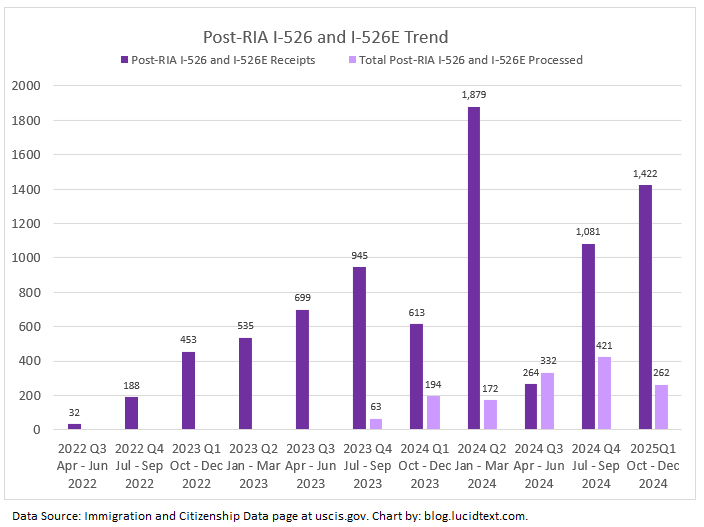
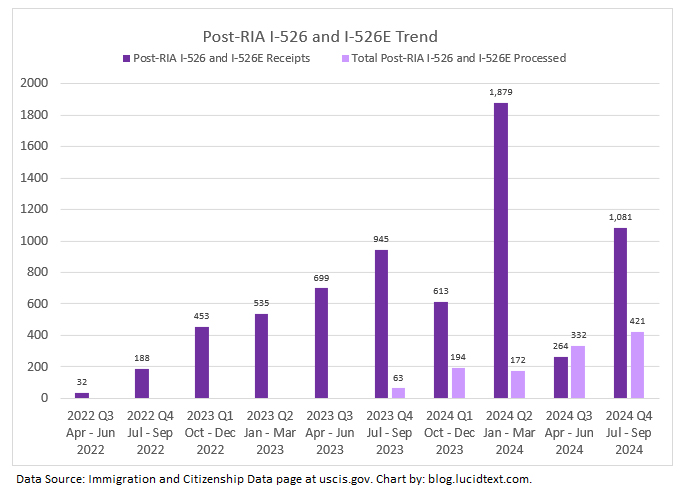
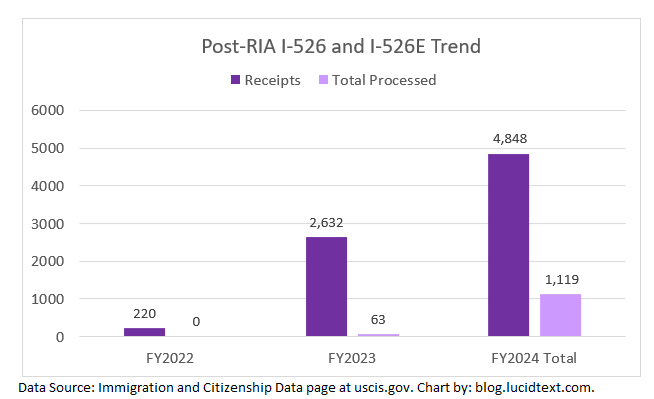
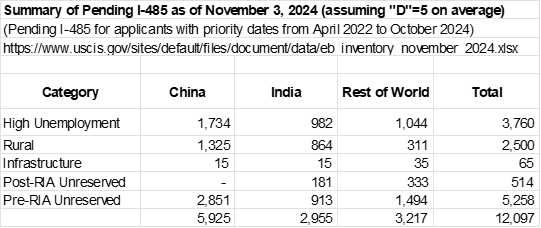
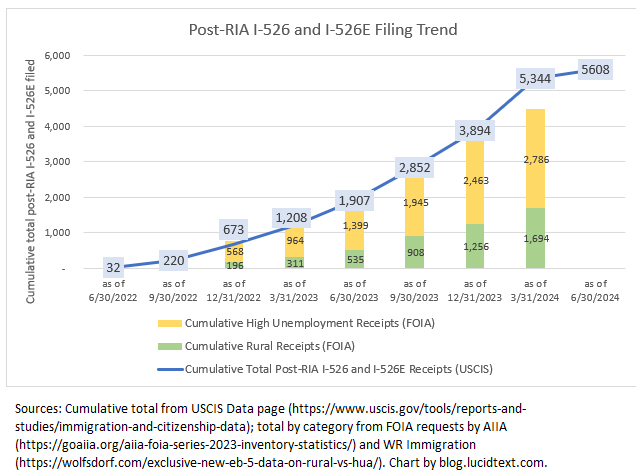
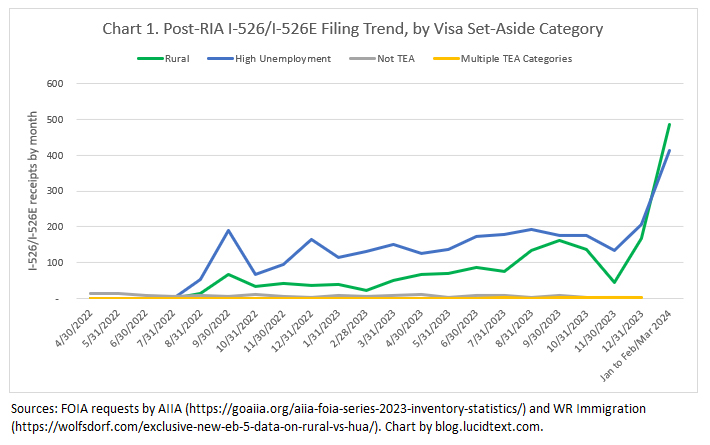
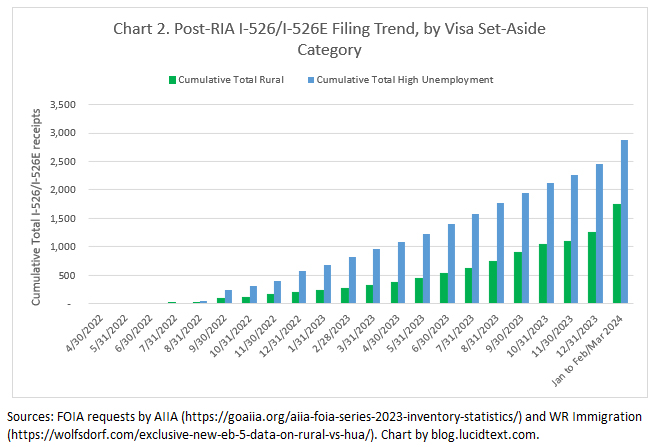
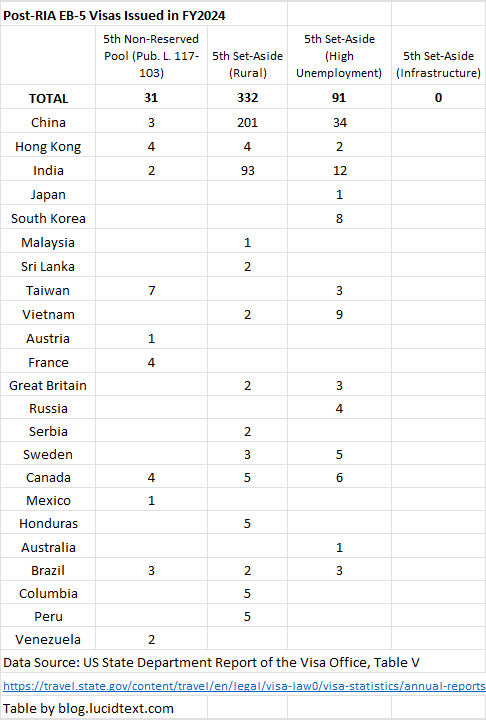
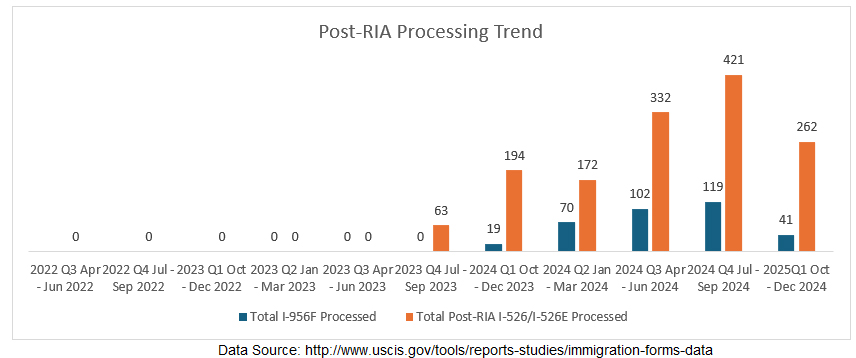
The data is not good news from a post-RIA investor perspective. Already-too-large backlogs are getting larger, and an already-too-slow process has been slowing down. Set-aside visa issuance proved low in FY2024 (just 332 Rural and 91 High Unemployment visas issued), and has stalled since March 2025. I-526/I-526E adjudication volume was already low in 2024 and has fallen since then (with just 219 processed in FY2025 Q2). Meanwhile, FY2025 Q2 yielded another bumper crop of new investors with 1,918 I-526/I-526E filings, bringing the post-RIA total to over 10,000 investors. As those 10K investors become 20-30K visa applicants, they’ll overwhelm the 3K annual limit for set-aside visas. Approval rates remain high, which is good for individuals but bad for the backlog. The Visa Bulletin remains current, which is good for people filing I-485 but bad for the backlog. The median processing time for completed I-526E is low (just 11.7 months in Q2) — which is nice for the 3% of I-526E completed in Q2, but no indicator for the 97% of cases not completed. I am interested to note the 31 post-RIA Unreserved visas issued in FY2024 — contradictions/exceptions to what I’d assumed to be the rule: that Unreserved visas get issued in priority date order with the pre-RIA backlog going first.
Data Insights for Regional Centers
Regional centers have facilitated an influx of over 10,000*$800,000=$8 billion dollars from EB-5 investment since 2022. This is great for the U.S. economy and job creation — and also 8x more investment than underwritten by the visa incentive (considering about 3,000 annual set-aside visas able to accommodate about 1,200 annual investors, or about $960M investment).
Slow processing times and low visa issuance are a win for capital raises, because they delay the day of public reckoning with backlogs. The Visa Bulletin can continue to show its encouraging “C” for Rural, High, Unemployment and Infrastructure so long as only a trickle of investors are getting I-526E approvals and becoming visa applicants, while the majority of the backlog stays hidden in I-526E processing. (If I-526E filed through 2024 had all been approved by now, and if DOS were issuing visas, then today’s Visa Bulletin would have final action dates for every country in High Unemployment, and for China and India in Rural.)
Who has to care about the hidden backlog? Or about continuing to accept in three months more investors than could possibly get visas in a year (as happened in FY2025 Q2)? Is it right to offer “immigrant investment” while saying “I honestly have no idea when you’ll be able to immigrate based on this investment”? And even for people who care, what can be done? Could any data milestone make the market/industry collectively decide “this is has gone too far, let’s choose to pause?” Some of us have made this call individually, but there’s no mechanism for the market to regulate itself.
If only EB-5 could get more visas! The program has an outsize economic impact, contributing $184 billion to U.S. GDP from investment in 2016-2019 alone, according to the recent Fourth Economy Economic Impact Analysis. Fourth Economy calculated that EB-5 created an average of 45 American jobs from each EB-5 investor, and has potential to generate 3.1 million American jobs annually if only supported by sufficient visas.
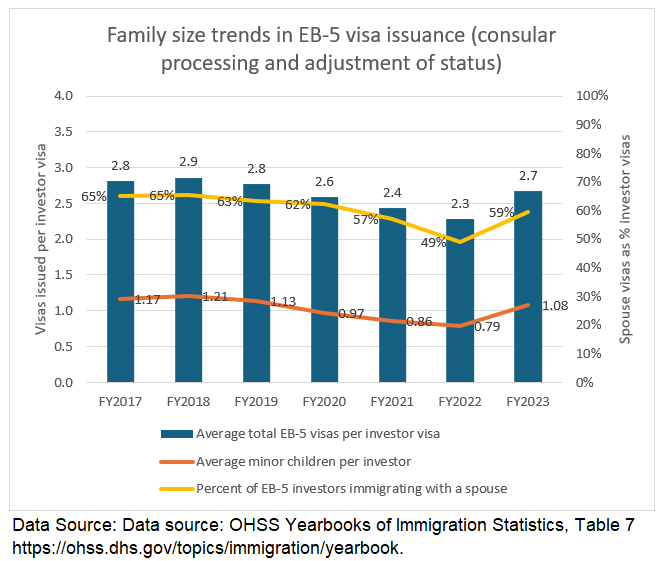
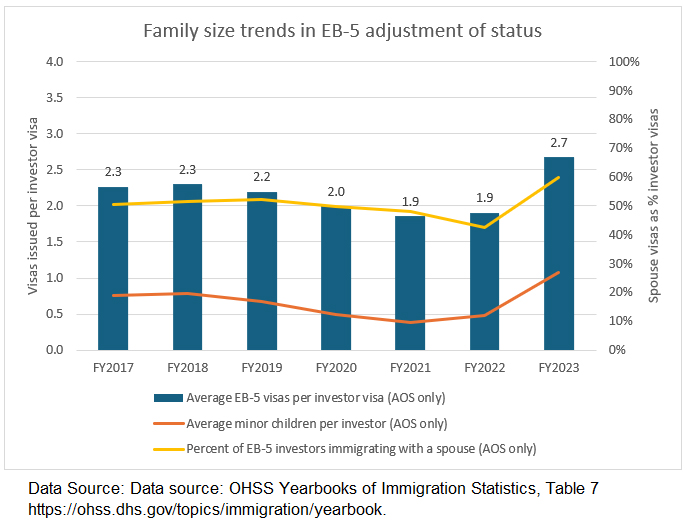
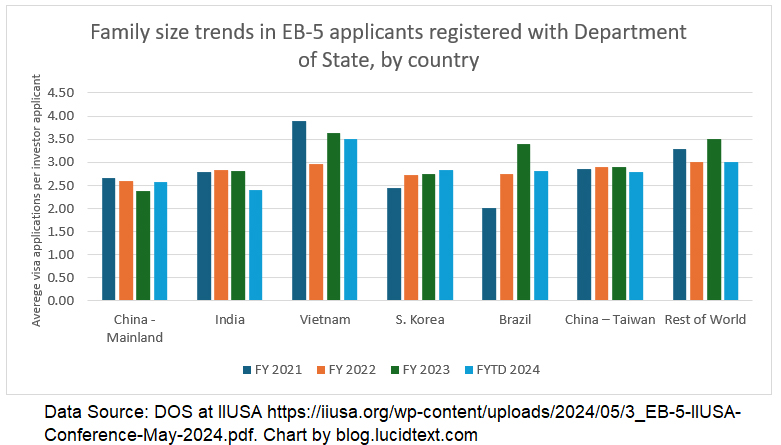
FY2024 Annual Report Summary

FY2025 Q2 Processing Data


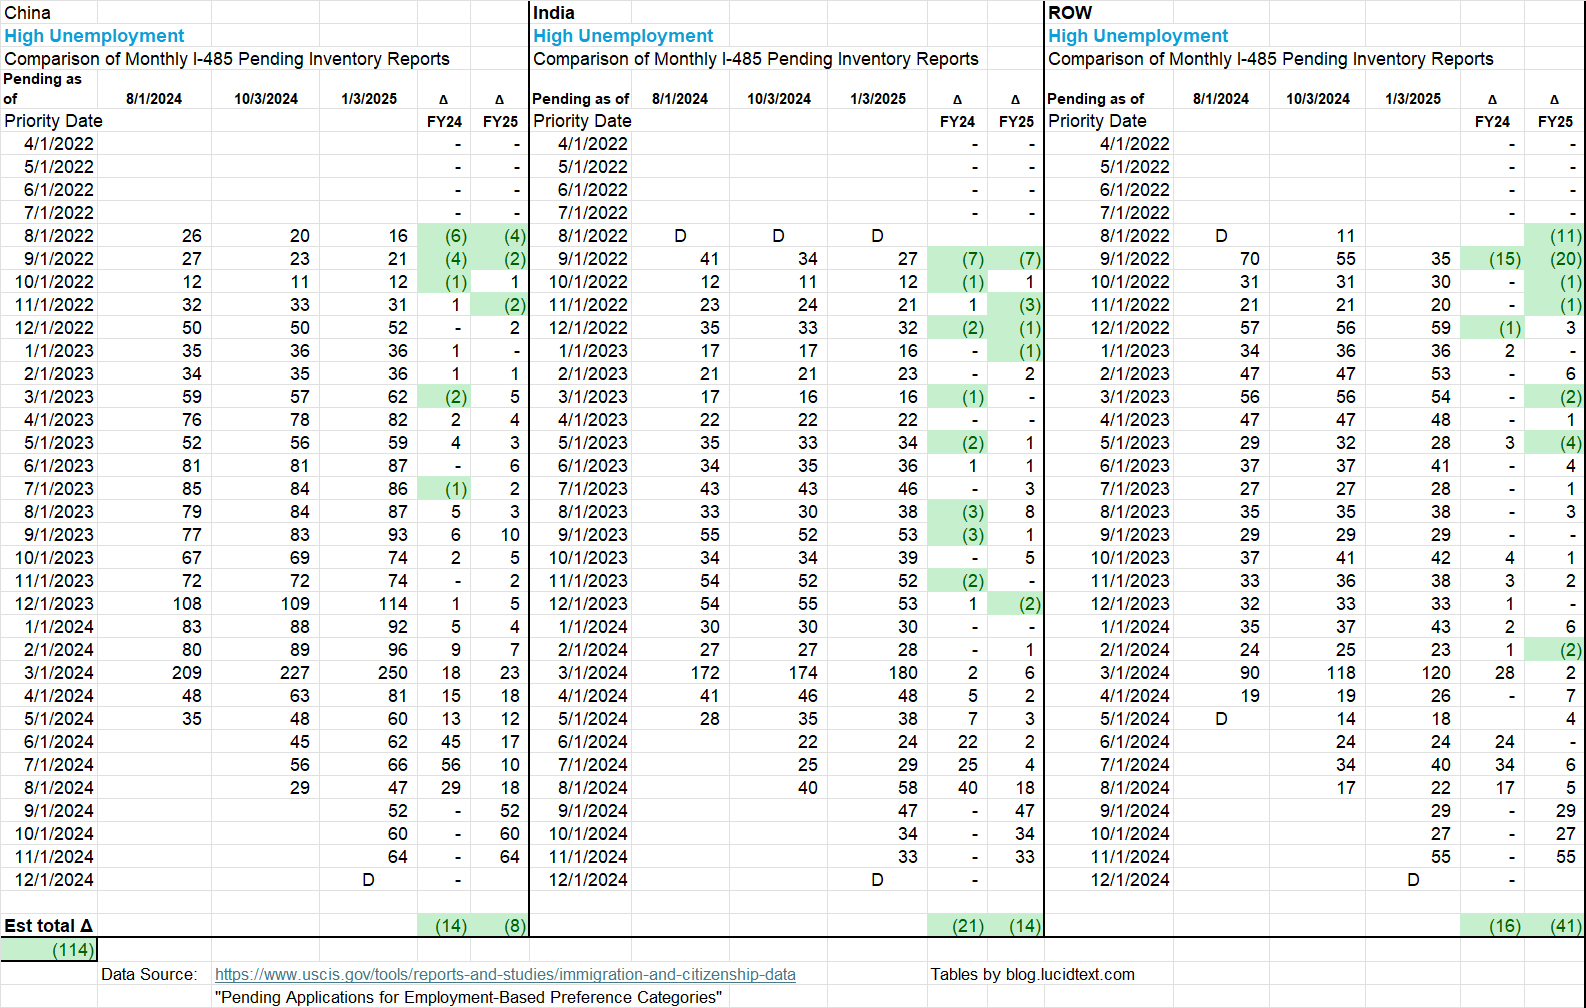
FY2025 I-485 Trend


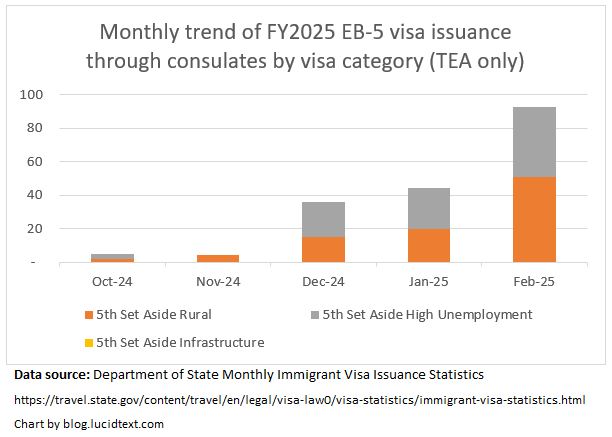
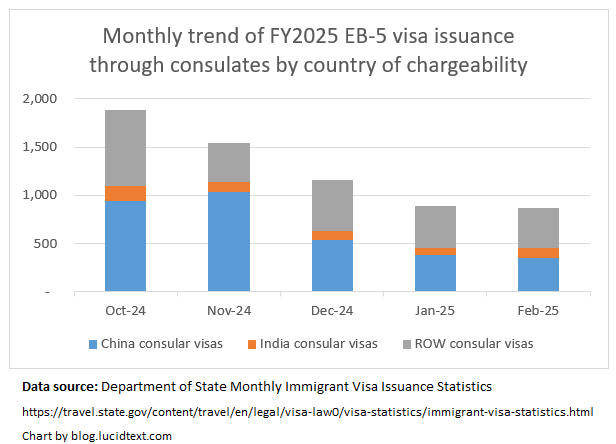
FY2025 Consular Processing Trend