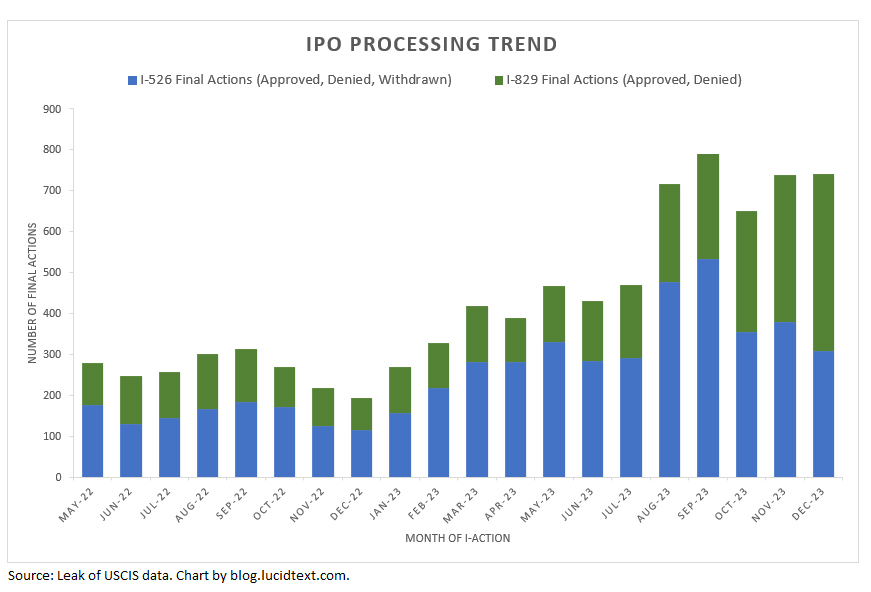
And finally, I get to report good news! The Investor Program Office seems to be turning a corner with petition processing. Official results aren’t out yet for months since September 2023, but preliminary data for recent pre-RIA I-526 and I-829 completions show the continuation of an encouraging trend. We’re hearing anecdotally about timely post-RIA I-526 and I-526E adjudications as well. Kudos to USCIS Director Jaddou and IPO Chief Emmel, who promised the improvements that we’re now seeing realized. As processing volume significantly increases, processing times have a chance to come down. For detailed analysis of what’s changed behind the scenes with I-526 and I-829 processing, and implications for processing times going forward, see my article “Recovery for EB-5 processing times” guest published on the Houston EB-5 blog. I have a pipeline of articles in process for industry colleagues, and will link here as time permits for publication. I also regularly update the Processing Data page on this blog.
A couple weeks ago AIIA published the results of a Freedom of Information Act request showing that as of the end of 2023, at least 1,093 rural investors and 2,185 high unemployment investors had filed EB-5 petitions with USCIS. (See the AIIA post for the data and link to an extensive webinar.) Now there’s the battle of interpreting and forecasting from those numbers. What will happen when those investors from 2022/2023, together with their spouses and children, encounter visa availability that’s about 4,000 in the first year and 2,000 in subsequent years for rural, and 2,000 in the first year 1,000 in subsequent years for high unemployment (with further limits from country caps once total visa-stage demand exceeds total supply)? How bad or not-bad-at-all could the backlog situation possibly be for rural and for high unemployment set-asides, considering the scope for variation in assumptions about final visa demand and future visa supply? I think the best industry analysis so far is from IIUSA, which just put out a report by Lee Li “Calculating Demand and Supply for Reserved EB-5 Visa Numbers: Data, Factors, Knowns, Unknows, and Estimates.” I like Lee’s analysis because it doesn’t imply only one possible conclusion from the I-526E data and also doesn’t just say “there’s uncertainty in the variables” and then stop, as if implying that any uncertainty means “so don’t bother thinking about this, you can’t and shouldn’t try to account for this, there are no reasoned conclusions to be drawn, really anything could be possible, believe whatever you/I want you to believe.” Instead, Lee’s analysis models a way to take uncertainty in hand and consider a reasonable range of probability by modeling scenarios. Lee’s analysis focuses on the I-526E inventory as of the end of 2023. We can use the same approach to run scenarios for the possible situation as of today, as exacerbated by another four months of I-526E filings. (To facilitate projections, I recommend getting AIIA’s detailed report of filings by month.)
So long as I’m recommending articles, I’d also like to mention David Bier’s illuminating paper “Green Card Approval Rate Reaches Record Lows” (February 15, 2024). The article isn’t specific to EB-5, but a reminder of demand/supply imbalance issues throughout the immigration system. The charts and graphs alone are excellent and thought-provoking, and I much appreciate his analysis and conclusions.
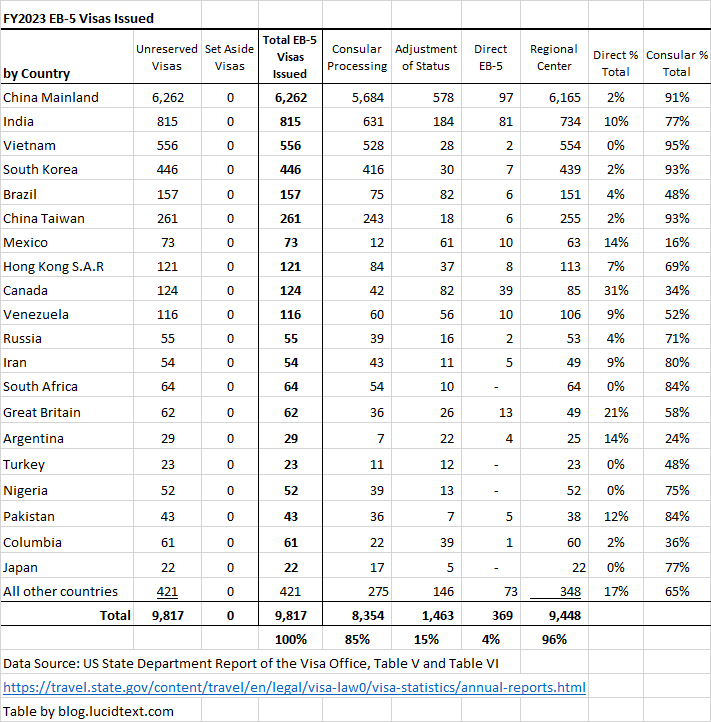
The Department of State has published its Report of the Visa Office 2023, including the final tally of EB-5 visas issued by country through consular processing and adjustment of status in FY2023.
The visa office report can be examined as an indicator of market interest in EB-5 visas, showing the countries of origin for EB-5 applicants in the last year, whether those applicants were already residing in the U.S. (thus adjusting status) or located abroad (getting visas through consulates), whether the applicants invested in regional center or direct projects, and whether the applicants chose Targeted Employment Area investments. At the very end of this post, you’ll find the tables I typically make to summarize visa office report data relevant to EB-5 market demand. Spoiler: EB-5 visas are still overwhelmingly going to applicants in Asia based on investment in regional center legacy TEA projects. (In FY2023, Department of State was not able to issue any set-aside TEA visas.)
But first, I’ve prepared tables based on my primary interest: what the visa office report tells us about visa backlog status for China, India, and Rest of the World countries. For my first chart, I take FY2023 EB-5 visa issuance numbers and put them in context of the 11/2022 NVC wait list (which shows how many EB-5 applicants were registered and waiting at the National Visa Center at the start of the fiscal year), and FY2023 visa availability (which shows how many EB-5 visas could/should have been issued under numerical limits during the fiscal year).
The good news for everyone: visa issuance in FY2023 met and even slightly exceeded the EB-5 annual limit (at least for unreserved) for the first time since 2017! No unreserved EB-5 visas wasted!
Good news for India and China. DOS did not limit India to 7% of unreserved visas in FY2023, but allowed nearly 7% of total EB-5 visas. China was allocated thousands more visas in FY2023 than one might have expected given the number of “rest of the world” applicants waiting for visas. On the other hand, Chinese and Indians should note the difference between applicants who were registered at NVC in late 2022, and consular visas issued in 2023. The difference equals the number of applicants who were already waiting in 2022 and apparently still waiting a year later: a difference that gives a reality check for interpreting the visa bulletin. Realizing that 731 Indians who registered at NVC in 2022 or earlier still didn’t have visas in late 2023, we know that the inventory of pre-2020 Indian priority dates can’t be clear, regardless of visa bulletin dates, unless denial rates were extremely high. I’ll be interested to see the NVC wait list as of 11/2023, which should be published shortly.
I’m most concerned looking at the visa issuance numbers for countries other than China and India, which are not limited by country caps and yet left many applicants behind. (As DOS clarified in 2023, country caps only limit the short list of countries that exceed 7% across all EB+FB categories. China and India are the only countries that are both high demand in EB-5 and also high demand across all visa categories. But countries without the individual 7% limit can still run up against constraints.) Of the more than 5,000 Rest of World EB-5 applicants registered at the National Visa Center in late 2022, over 3,000 didn’t get visas in FY2023. Those applicants weren’t constrained by anything in FY2023 except consular capacity to schedule interviews; technically 3,000 visas could have gone to them in FY2023 instead of being considered “otherwise unused” and assigned to China over China’s country cap. (Unless denials account for a significant part of the gap, but the consular EB-5 denial rate is historically not very high — averaging 9% in 2016-2021.) DOS apparently left many ROW applicants to wait in a small backlog, which I foresee is about to become a large backlog as USCIS is finally aggressively approving I-526 and advancing thousands more ROW applicants to the visa stage. (Another post on this coming soon – the latest I-526 and I-829 processing numbers are excellent.) Backlogs can be a wait time issue even for countries not subject to country caps, as you know by looking at any visa bulletin and seeing the final action dates for ROW in EB-2, EB-3, and EB-4. The backlog tipping point in EB-5 for “rest of the world” countries will come when ROW applicants for unreserved visas collectively exceed 86% of unreserved visas available – i.e. when ROW unreserved reaches about 6,000 applicants. (Logic: Chinese and Indian unreserved applicants have older priority dates than most ROW applicants, so Chinese and Indians will get allocated EB-5 visas first up to the 7% cap for each country, collectively claiming 14% of visas. So more recent ROW applicants collectively can’t be allocated more than 86% of visas in a year, and any ROW applicants exceeding that threshold will be cut off by the visa bulletin and have to wait for visa availability in a future year.)
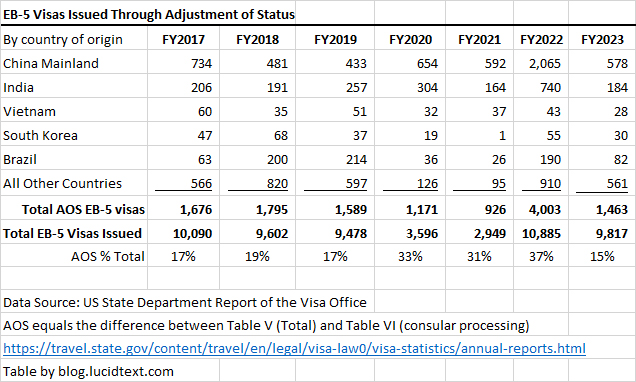
I went on to make a table showing the multi-year trend in visa availability, demand, and issuance for China, India, and ROW. The table highlights the tragedy of 2020-2022, when COVID-19 followed by the nearly year-long regional center program shutdown resulted in the loss of 25,880 EB-5 visas. The table illustrates that processing capacity for ROW visa issuance has been a long-term problem, with consulates regularly issuing thousands fewer visas than available to and demanded by ROW. On the other hand, this problem for ROW has been a boon to applicants from China, whose numbers depend on the number of visas leftover from ROW (except in 2020-2022, when China’s numbers sadly depended on a closed consulate and closed regional center program).
In thinking about supply and demand for unreserved visas, we want to not only look at what’s been happening at the visa stage, but also visualize what’s coming down the pipeline as more I-526 get approved. The following table shows the steps I take to estimate the total pipeline demand for unreserved visas as of the end of 2023. Note that this table only estimates demand from pre-RIA investors. Any post-RIA investors who go for unreserved visas will be placed – based on priority date order – at the end of the pre-RIA queues. In other words, my estimate of the existing unreserved visa pipeline suggests that a post-RIA applicant for an unreserved visa would find himself #40,000+ in the China unreserved queue, #5,000+ in the India unreserved queue, or #15,000+ in the Rest of World unreserved queue. Not the place to be, with only 6,800+ total unreserved visas available annually! We’re concerned to see the set-aside queues filling up, because there’s obviously no room for spill-over into the unreserved category.
Calculation Steps
Pre-RIA Unreserved Visa Demand Estimate
China Unreserved
India Unreserved
ROW Unreserved
Total Unreserved
Note
A
I-485 pending as of 10/1/2022
736
234
893
1,864
Total is actual; per-country is a guess considering visa issuance
B
NVC wait list as of 11/2022
38,874
1,362
5,262
45,498
Actual
China
India
ROW
C
Consular visas Issued FY23
5,684
815
1,855
8,354
Actual
D
AOS visas issued FY23
578
184
701
1,463
Actual
E=C+D
Total Visas Issued 2023
6,262
815
2,740
9,817
Actual
China
India
ROW
F=B-C
People waiting at NVC in 11/22 still waiting in 11/23
33,190
547
3,407
37,144
Actual
G=A-D
I-485 pending as of 11/22 still pending as of 11/23
158
50
192
401
Total is actual; per-country is estimate
China
India
ROW
H
Estimated new visa applicants in 2023 from I-526 approvals in 2023
1,000
1,500
4,100
6,600
Estimate from I-526 approvals in 2023 (world is actual, per-country is guess based on known per-country inventory as of 3/2022 and PD of I-526 approvals in 23), assumes 2.5 visas per approval
I
Estimated future visa applicants from pre-RIA I-526 currently still pending as of 11/2023
6,000
3,000
8,000
17,000
Estimate from pending inventory (world is known, per-country is guess based on known per-country); estimate 2 visa demand per pending I-526
China
India
ROW
J=F+G+H+I
CONCLUSION: Estimated total pre-RIA unreserved visa pipeline as of 11/2023
See “AIIA FOIA Series: Updated I-526E Inventory Statistics for 2023” (February 29, 2024) for another important update on pipeline demand for rural and high unemployment set-aside visas. I helped make the charts for this article, and encourage everyone concerned about potential backlogs and wait times to read the article, donate to AIIA (so they can keep doing this!), get the Excel from AIIA with all the details, and work on your own analysis. (Shout-out to Matt Galati, who donated his formidable litigation skills to pushing the data request through the FOIA process.)
I don’t have time at the moment to write in detail about what I see, and in any case I advise that you start by grappling with the facts yourself. Then you’ll be prepared to interpret the variety of motivated/limited conclusions that you will hear from others. EB-5 supply/demand and timing analysis is complicated in detail but basically simple: demand > supply = backlogs and wait times. And so we try to track demand.
The data we can get from USCIS — a count of I-526 and I-526E receipts by petitioner country of origin and TEA category — is not an exact predictor of future visa demand. But it’s extremely useful to know, at least, how many investors have entered the queues for rural and high unemployment visas, even as we have to guess about factors such as queue speed through USCIS processing, denial rates, family sizes at the visa stage, and pace of incoming demand since the last report. (I refer to the new queues as “pipeline demand” for rural and high unemployment visas, because so far it is still mostly just in the pipeline, not at the visa stage. I watch the Department of State monthly visa issuance reports, and no set-aside visas had been issued by consulates yet at least up to last report for January 2024.)
A note on dates: it’s a little hard to tell how many months are fully accounted for in the latest FOIA response. USCIS sent AIIA a table with rows through January 2024, but entered just a few numbers in the rows for recent months. Unless people almost stopped filing petitions over the winter, I guess that the latest FOIA request gives data that’s complete through at least October 2023, only partially counted for December and January, and maybe partially counted for November. (If only USCIS had better systems, and could just print reports without so much struggle and fuss! As it is, I suspect that these FOIA responses require someone going to the warehouse and shuffling through paper to make a tally.) But even if we only look at the I-526 inventory accumulated up to November 2023, there’s already a significant message about demand versus future supply of EB-5 visas.
The Final Rule includes major increases to EB-5 form filing fees, which is a near-term gift for EB-5 marketing (“Hurry! File now before the fees go up!”), a challenge for service providers (as we try to accommodate the feast of applicants rushing to beat the fee increase and to plan for the subsequent famine), and a long-term benefit to USCIS coffers and burden on EB-5 users (to the extent that EB-5 forms still get filed under the disincentive of increased fees on top of insufficient EB-5 visa availability).
The new EB-5 fees will take effect from April 1 unless or until blocked by litigation or superseded by another EB-5 fee rule. Litigation successfully cancelled the last USCIS fee increase attempt in 2019/2020; I don’t know about litigation prospects this time. DHS is separately working on a different fee study for EB-5 that was mandated by the EB-5 Reform and Integrity Act and due by March 2023. The RIA-mandated study will eventually result in different EB-5 fees designed to support timely processing, but “that effort is still in its early stages” according to the Final Rule. DHS explains that “the provisions of the law are not effective until DHS takes the steps it requires to be implemented.” We fans of Yes Minister know how to interpret the Final Rule statement that DHS has so far “initiated a working group to begin drafting the rule” required to support timely EB-5 processing.
The EB-5 fee increases in the Final Rule are identical to those proposed last year in the Notice of Proposed Rulemaking (NPRM). Good old DHS listened to the chorus of public criticism on the NPRM and accepted some of our corrections – including on the key variable of EB-5 filing volume – but did not recalculate the EB-5 fees in the Final Rule. Multiplying projected annual receipts by filing fee, we can see that the NPRM anticipated generating $80.7 million in EB-5 fee revenue, while the Final Rule projects $139.7 million in EB-5 fee revenue. DHS initially calculated high EB-5 fees based on the need to spread costs across projected low fee-paying receipt volume, then realized receipt volume could actually be much greater, but still decided to keep the high fees.
Summary of EB-5 filing fee changes
Form
Filing fee since 2016
Proposed filing fee in NPRM
Projected annual receipts in NPRM
Projected annual receipts in final Fee Rule
New filing fee effective 4/1/2024, per Final Rule
I-526/I-526E
$3,675
$11,160
3,900
4,050
$11,160
I-829
$3,750
$9,525
3,250
4,500
$9,525
I-956
$17,795
$47,695
62
400
$47,695
I-956F
$17,795
$47,695
600
$47,695
I-956G
$3,035
$4,470
728
875
$4,470
I-956H
0
0
2,000
0
I-956K
0
0
500
0
Total or Weighted Avg.
$10,163
7,940
12,925
$10,806
Here is the formula that DHS uses to calculate filing fees according to its “full cost recovery model,” and how the inputs changed for EB-5 between the NPRM and Final Rule. (For detail, see my exhaustive article for IIUSA on the NPRM fee-setting methodology.)
Fee Setting Formula
Difference in inputs and results between NPRM and Final Rule for EB-5 forms
A
Cost Baseline: “the resources necessary for individual USCIS offices to sustain operations and deliver services.”
No change indicated (NPRM reported this amount as $59.4M)
B
“Average Annual Projected Workload Receipts”
Increased in Final Rule
C=A/B
Fee per receipt required for cost recovery
Decreased in Final Rule
D
“Cost Reallocation”: Additional fee “to provide services for which USCIS does not receive revenue”
Increased, apparently
E=C+D
Filing fee per receipt
No change
In the Final Rule, DHS increased its estimate of EB-5 fee-paying receipts while deciding to keep EB-5 filing fees the same. In other words, DHS apparently decided to increase cost reallocation to itself instead of passing along anticipated economies of scale to the customer. As the Final Rule notes with satisfaction: “Increasing the fee-paying receipt forecasts for these workloads conversely increased the estimated revenue generated by EB-5 fees. DHS also revised the USCIS budget to reflect these changes.” The EB-5 program not only has no cost to the US taxpayer, it actually helps to fund the government with form filing fees calculated to generate millions of dollars to USCIS above the anticipated cost to process EB-5 forms. Table 11 in the Final Rule quantifies cost/benefit impacts, and notes that “Annual transfer payments from EB-5 investors and regional centers to USCIS will be approximately $44,746,040.”
As the Final Rule explains: “Full cost recovery means not only that fee-paying applicants and petitioners must pay their proportionate share of costs, but also that at least some fee-paying applicants and petitioners must pay a share of the immigration adjudication and naturalization services that DHS provides on a fee-exempt, fee-reduced, or fee-waived basis. …Under the ability-to-pay principle, those who are more capable of bearing the burden of fees should pay more for a service than those with less ability to pay. The requirements of immigrant investor program indicate that immigrant investors and regional centers have the ability-to-pay more than most USCIS customers.”
(To be fair the net windfall to USCIS is only theoretical, since actual receipt volume will likely fall far below USCIS estimates. It’s not wise for the government to plan on ongoing fee revenue from 600 new EB-5 projects and more than 4,000 new EB-5 investors per year when it only offers enough visas to accommodate fewer than 2,000 new EB-5 investors per year on average, considering set-aside visa numbers and spouses/children.)
Here is an index with links to content in the Final Rule relevant to EB-5 stakeholders.
Feedback opportunity: Invitation to public engagement on Feb 22, and to submit questions by Feb 8.
My top questions when I look at new EB-5 data: what’s the latest news on pipeline demand for post-RIA visa numbers? How many regional center projects are on the table, and what progress is USCIS making in adjudicating project applications and investor petitions? Are processing volumes increasing or decreasing for pre-RIA and post-RIA forms? What’s the latest news on I-956 and I-956F processing times?
Trend for I-526 and I-526E receipts
Are post-RIA investor petition numbers continuing to climb? How does incoming and cumulative demand look when compared against set-aside visa availability?
Answer from Q4 data: The linear upward trend continued, for a cumulative total of over 2,600 post-RIA I-526 and I-526E filed as of September 30, 2023. (The figure could be nearly 3,000 if one sums quarterly receipt numbers instead of believing the period-end pending and processed numbers.)
If we assume a visas-to-investor ratio of at least 2-to-1 (thinking about family sizes and denials), then 2,600 petitions filed translates into potential demand for at least 5,200 post-RIA visas accumulated in the pipeline as of September 2023. If we guess that filings in Q3 and Q4 continued the previous category breakdown (known from AIIA’s FOIA request of data through Q2) of 23% rural and 70% high unemployment, that would likely mean at least 1,200 pipeline rural applicants and at least 3,600 pipeline high unemployment applicants accumulated by September. If we guess that demand since April moved 100% to rural (the unlikely worst-case scenario for rural and best-case scenario for HU), that could mean at least 4,000 rural and 2,000 HU visa demand in the pipeline by September 2023. The pipeline — continuing to grow as I-526E continue to come in — is headed toward visa availability of about 4,000 rural/2,000 high unemployment in the first year, and about 2,000 rural/1,000 high unemployment in subsequent years. Important considerations for people wondering about future visa wait times that are a function of visa demand exceeding visa supply.
I-526E filings show strong demand to invest in the U.S. and support U.S. job creation; we need visa numbers sufficient to support and sustain that potential. An important advocacy focus for the EB-5 industry, as we face 2024 and beyond.
I-956 and I-956F Volume and Processing Times
How many projects are potentially out in the market raising EB-5 capital, and how many have been reviewed by USCIS? How many regional centers has USCIS reviewed for compliance under RIA?
Answer from Q4 data: USCIS reports a total 12 I-956F project applications processed in FY2023, and 231 I-956F project applications still pending at year-end. In other words, USCIS had reviewed only 5% of the total projects potentially out raising funds. However, I have personally heard about many I-956F approvals in December 2023, so hopefully the next quarterly I-956F report will look better. And I’m happy to see that USCIS has reviewed at least 148 (nearly 40%) of the 379 I-956 regional center applications filed through September. For whatever reason, USCIS is not disclosing denial rates for either I-956 or I-956F – only reporting on total forms processed. The median processing time looks good for the few forms that did manage to get processed – 9 months for I-956 and 12.8 months for I-956F. (This is a nice reference for applicants whose forms that didn’t get processed yet, and who may want to file Mandamus actions.)
How is USCIS doing on advancing post-RIA applicants to the visa stage by approving I-526E investor petitions?
Answer from Q4 data: I-526E processing data appears for the first time on the Q4 report, which records 63 I-526E approvals (no denials) both for FY2023 Q4 and the full year. If all 63 investors whose I-526E were approved in FY2023 Q4 can manage to get a FY2024 visa, that’s about 120 to 240 post-RIA visas. Not near the thousands of carryover visas available on a use-it-or-lose-it basis to set-aside categories in FY2024, but much better than nothing!
Pre-RIA I-526 and I-829 Processing
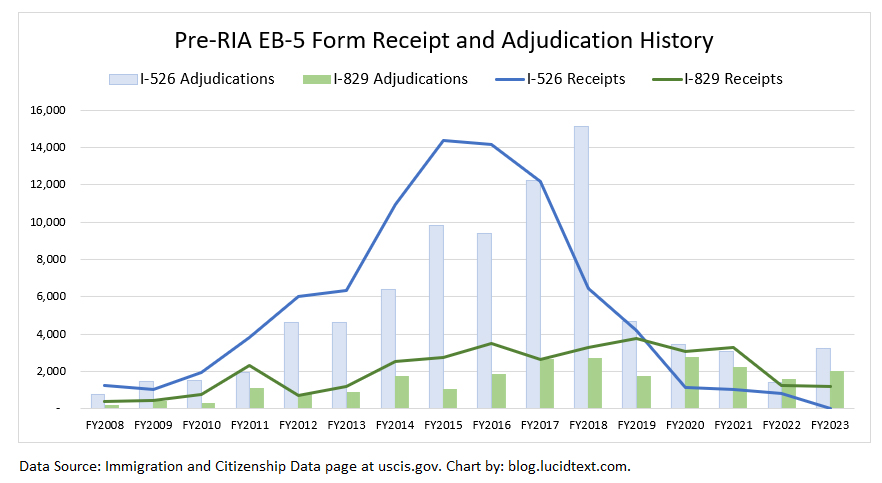
What’s happened to pre-RIA petition processing as USCIS also tries to accommodate the post-RIA workload? Are we anywhere near digging out of the processing collapse that started in 2019? How long will it take to clear the current I-526 and I-829 backlog, if recent processing volume continues?
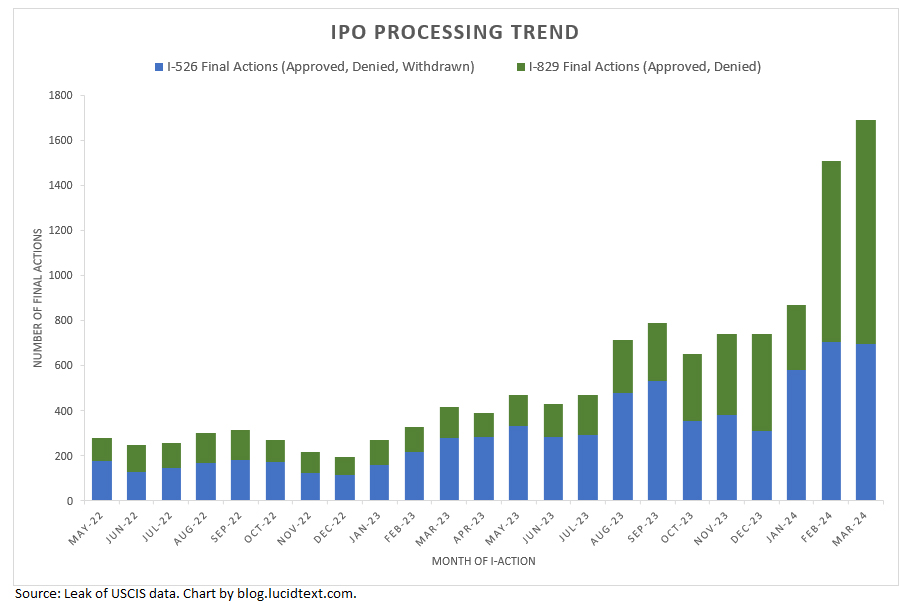
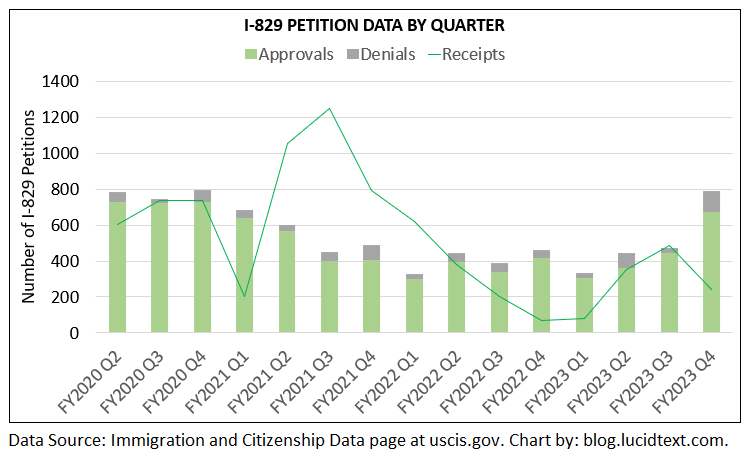
Answer from Q4 data: USCIS has not abandoned pre-RIA petitions, and obviously made extra effort to improve I-526 and I-829 volumes for the fiscal year-end. There’s been a fairly consistent improvement trend since the rock bottom of 2021, which is great to see. But in a wider context, the best efforts of FY2023 Q4 are still only barely as good as mid-Pandemic processing volume, and still three times lower than the I-526 volumes USCIS was achieving prior to 2019. FY2023 ended with just under 10,000 I-526 and 10,000 I-829 pending. You do the math for how long it would take to clear that inventory if USCIS continues to adjudicate at a rate of 1,300 I-526 and 800 I-829 per quarter. The Investor Program Office must continue to ramp up its efforts (not slack off, as we’ve seen so far in the months since September).
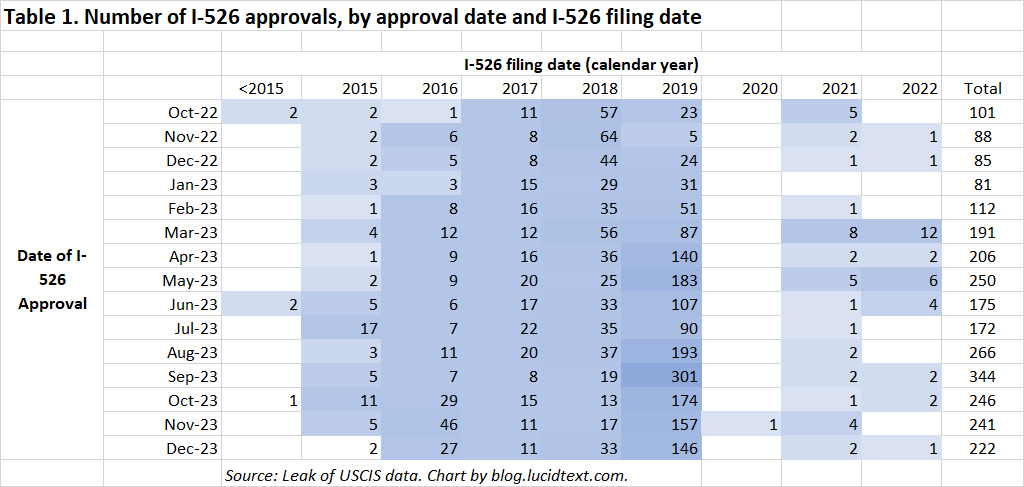
People at the back of the inventory for I-526 and I-829 processing need not necessarily despair about their processing times, however, because processing is not close to FIFO. I know from other sources that USCIS has recently primarily been processing I-526 filed in November 2019 – nearly the end of the I-526 queue – and has been approving many I-829 filed in 2020, 2021, 2022, and even 2023, even as the median I-829 processing time reflects cases filed in 2019. See the charts below and on my regularly-updated Processing Data page the processing distribution of recent I-526 and I-829 approvals.
The I-526 denial rate continues to appear very high (37%); however, I have inside information that more than half of the decisions reported in the I-526 denial category in Q4 were actually voluntary withdrawals. The I-829 denial rate was 15% in Q4 — slightly higher than average. USCIS has reported no I-526E denials yet.
And finally, a note for anyone who benefits from my data reports that you are welcome to help make all this work worthwhile with a Paypal contribution. Happy New Year!