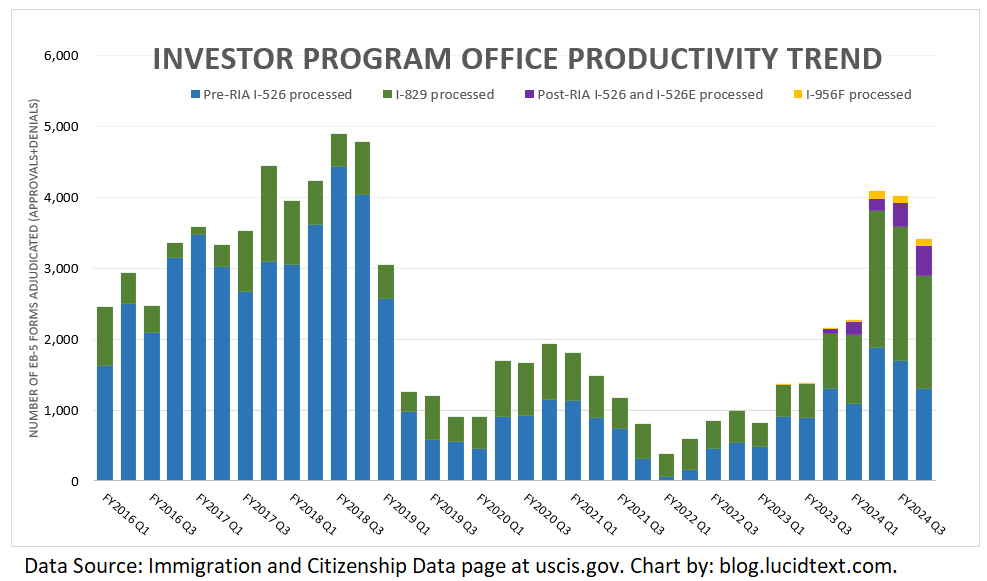
And now, the USCIS Immigration and Citizenship Data page has finally published performance data for the first quarter of FY2025 (October to December 2024). The data shows a strong start to implementing the new administration’s immigration agenda. Last time around, it took two years for USCIS staffing and policy changes to translate into sluggish EB-5 form processing. This time, IPO preemptively cut its processing productivity in half even before the inauguration. Maybe October to December was an aberration, with no political connection and no trend to worry about. But at least for the one quarter, every EB-5 form suffered. I had expected USCIS to start shifting more resources to I-526E, given the visa urgency and dwindling I-526 workload, but this did not happen through the end of last year. Meanwhile, as previewed in AIIA’s data by country and TEA category, I-526E filings continued to shoot up through the end of 2024.
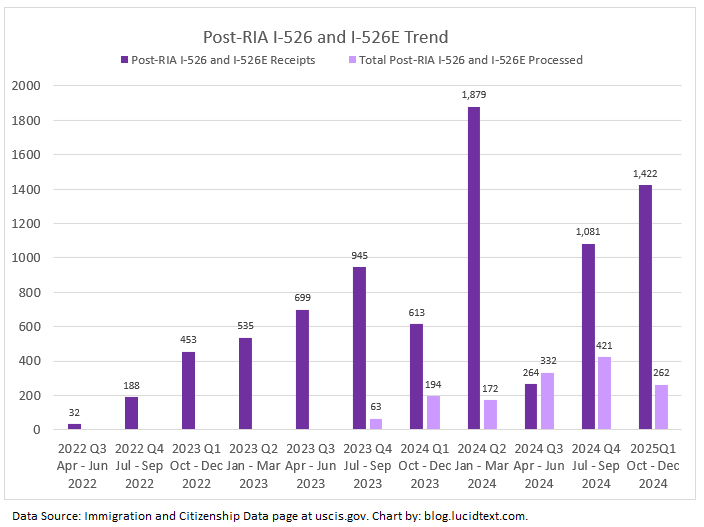
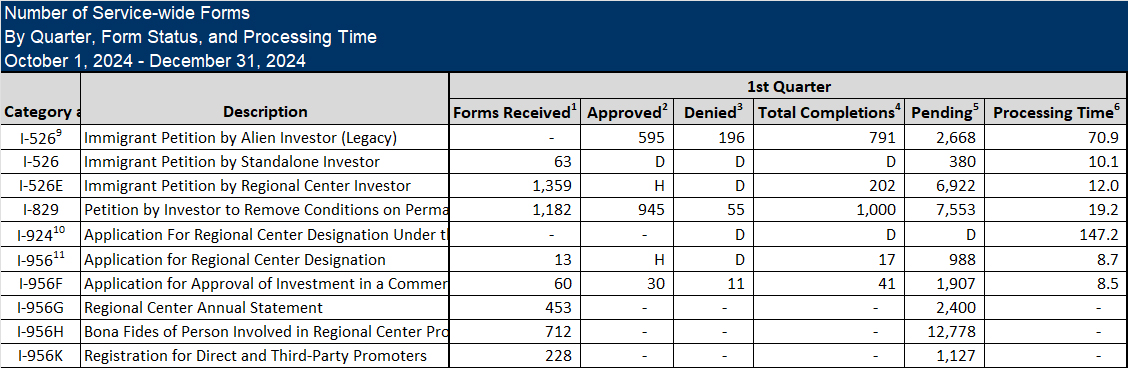
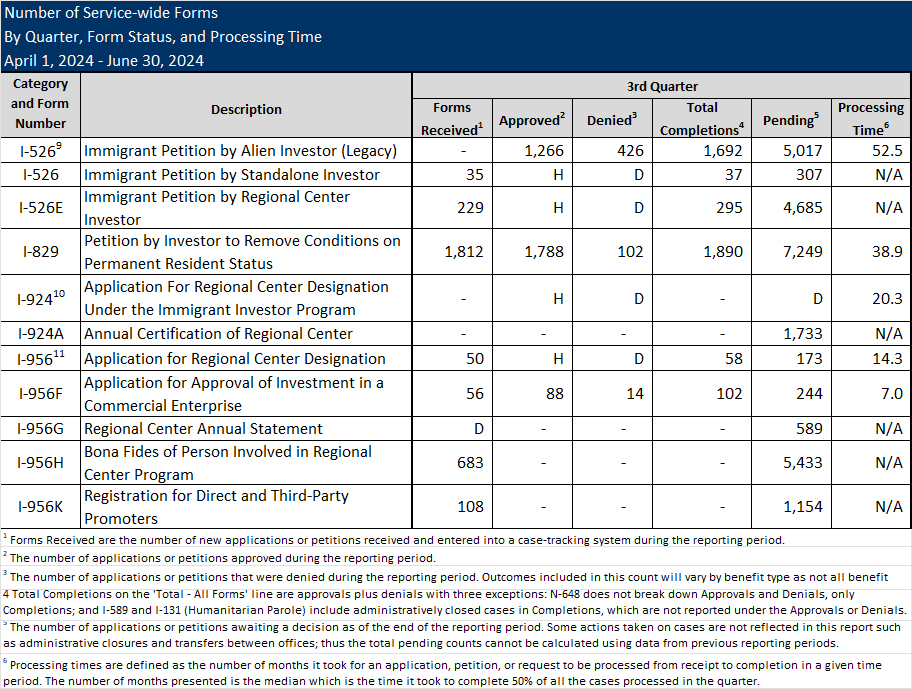
The FY2025 Q1 report is notable for including, for the first time, median processing times for post-RIA I-526 and I-526E.
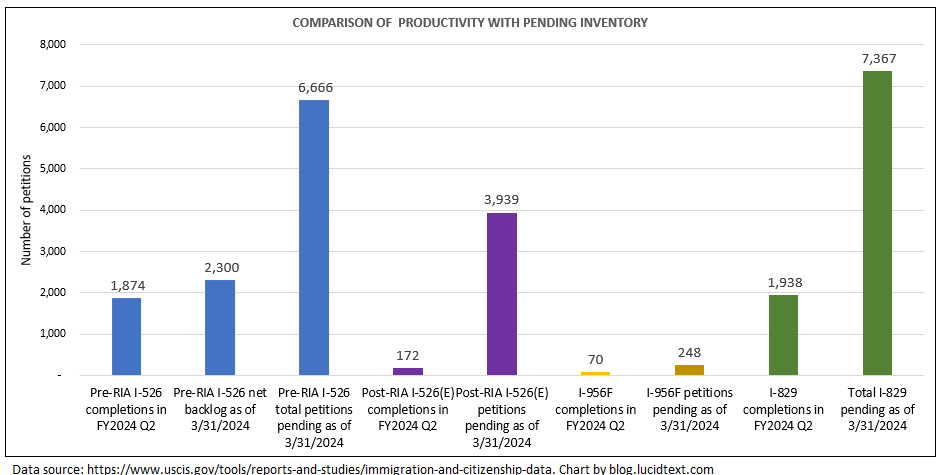
Be cautious in interpreting the Processing Time number, which is not necessarily predictive! Footnote 6 to the Processing Times column explains: “Processing times are defined as the number of months it took for an application, petition, or request to be processed from receipt to completion in a given time period. The number of months presented is the median which is the time it took to complete 50% of all the cases processed in the quarter.” I’m very happy for the 50% of recently-completed I-526E that experienced a processing time of less than 12 months. However, 50% of the 202 completions in FY25 Q1 is just 101 forms — barely 1% of the inventory. How long will it take to process the 6,922 I-526E that remained pending at the end of last quarter? If USCIS kept going at the FY25 Q1 processing pace, then it would take 6,922/202=34 quarters=8.6 years. In order to get through the pre-2025 I-526E inventory in 12 months from now, USCIS would have to increase quarterly I-526E processing volume to 6,922/4=1,730 completions. On the other hand, the reported median processing time of 19.2 months for I-829 may be reasonably predictive, so long as USCIS can keep processing the I-829 inventory (7,553 at last count) at a rate of at least 1,000 completions per quarter.
And now, we finally know what’s been happening with EB-5 demand and I-526/I-526E adjudications since mid 2024. See AIIA FOIA Series: Updated I-526E Inventory Statistics for January 2025. Thank you to AIIA, Galati Law, and the Freedom of Information Act! USCIS has not published any EB-5 data since September 2024, so we welcome this trove of new information about I-526 and I-526E receipts, approvals, and denials by country and TEA category through January 2025.
I will shortly revise my backlog analysis to incorporate this new information. My previous analysis made optimistic wait time estimates based on optimistic assumptions: that future EB-5 demand would remain at the level documented as of mid 2024, and that USCIS and Department of State processing would allow issuing available visas. My revised analysis must now downgrade these estimates. We now know that in fact, EB-5 demand shot up through the beginning of 2025, while processing volumes remained quite low.
The AIIA FOIA showed that “only 351 HUA and 1,126 rural petitions have been approved as of January 2025.” That’s likely too low for a year with 2,200 HUA and 4,400 rural visas available, and considering that visa interviews take months to schedule. If there aren’t enough applicants to claim available FY2025 set-aside visas, that means that the visa bulletin gets to stay “current” for a longer time (good news for concurrent filing), but some set-aside numbers will be permanently lost, Rest of World applicants will get more time to accumulate and crowd out China/India applicants, and expected visa wait times will lengthen.
Meanwhile, the AIIA FOIA showed the count of filed investor petitions reaching 5,191 High Unemployment and 4,329 Rural by the end of January 2025. That’s conservatively 10-11x annual HU visa availability and 4-5x annual Rural visa availability (considering that these investors may get I-526E approval and be joined by spouses and/or children to claim visas). Those are fearsome queues to enter the back of, for a new investor today. If a 2025 High Unemployment investor gets a visa in less than 10 years or a Rural investor gets a visa in less than 5 years, it will be thanks to country caps (allowing minority country investors to move ahead of earlier priority dates from China and India) and the possibility of category-switching (with Unreserved being an alternate lane as congestion builds in the TEA lanes.) I’m now anxious to get updated information on the pre-RIA backlog for Unreserved visas, to better assess Unreserved visas as a potential fallback for new HU and Rural investors.
Regional Centers will want to grapple with the fact that the coming 10+ years of HU visas and 4+ years of Rural visas have already been sold, even as a significant Unreserved backlog remains. Unless and until visa relief is possible, what’s left to offer is a chance for Rest-of-World EB-5 investors to cut the queue in front of earlier but cap-limited China-born and India-born investors. Keeping the “immigrant” in “immigrant investment” will require hard work for visa relief.
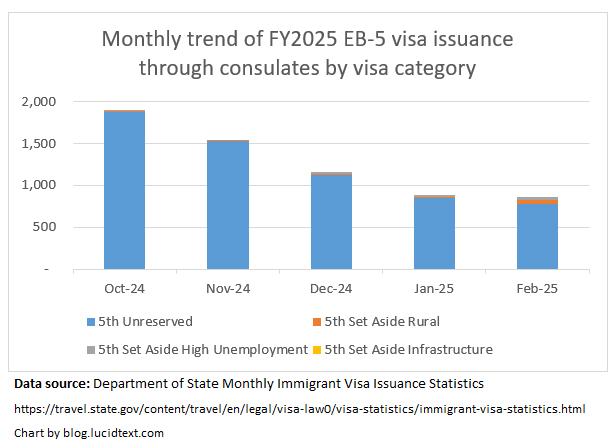
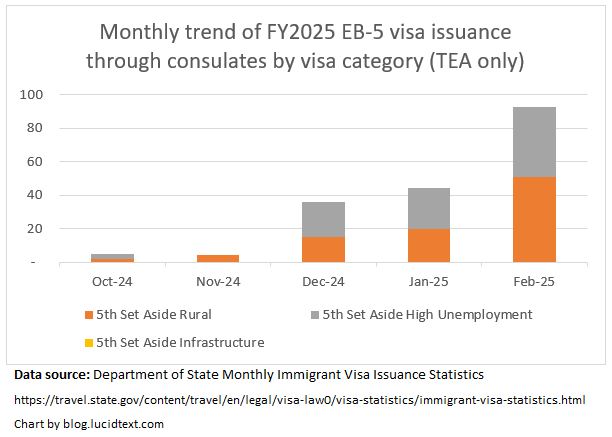
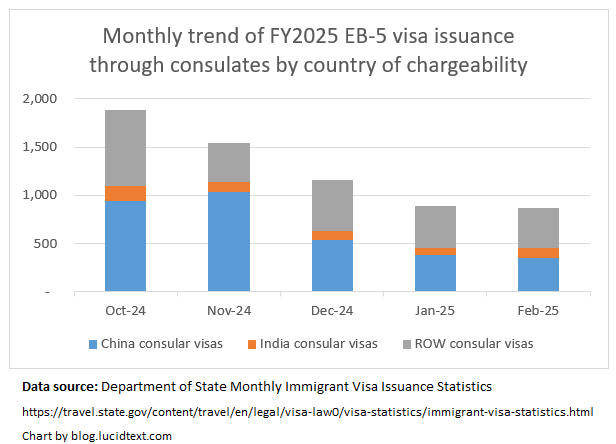
Finally a bit of data to report: Department of State has added Monthly Immigrant Visa Issuance statistics for consular processing in February 2025. I made a few charts to highlight EB-5 numbers.
February data shows set-aside visa issuance continuing to pick up steam but very gradually, with visa issuance still extremely low in context of set-aside visas available this year. If this trend continues, then I guess that Rural and High Unemployment visa supply may not be maximized this fiscal year, and thus Rural and High Unemployment may not get visa bulletin dates this year. I may revise this guess if and when USCIS ever starts reporting data again for I-526E approvals (indicating how many people are potentially qualified for visas) and I-485 approvals (indicating the number of visas being allocated through status adjustment). USCIS 2025 data reports are now very delayed, but I keep checking — hoping that the USCIS Office of Performance and Quality still exists! Also waiting on the delayed 2024 NVC waitlist report. If set-aside visa issuance remains low throughout FY2025, that would be good news for the concurrent filing window, and bad news for the pipeline backlog — especially for applicants from China and India who depend on getting through the visa gate as soon as possible before more rest of world applicants have a chance to get I-526E approvals. Actual visa wait times could be worse than calculated in my EB5 Backlog Analysis model in case of low set-aside visa issuance. (I’ll revise the entire model when the next USCIS and NVC reports finally come out.)
Looking at Unreserved visa issuance through consulates, I note that Department of State remains on track to issue all Unreserved visas available for the fiscal year. Good! But the rate of Unreserved visa issuance to rest-of-world countries did not increase in February — as I think it should have, given that ROW applicants are so numerous that DOS might even have to impose a ROW Unreserved a cutoff date this year (according to the April 2025 visa bulletin note). A number of consulates seem to be having problems with scheduling EB-5 interviews — for example in Nigeria, which has many EB-5 applicants but no EB-5 interviews at all this year. Can consulates be given a push to act on EB-5 cases? On the bright side, low EB-5 visa issuance to ROW meant that China-born applicants were able to continue to pick up “otherwise unused” Unreserved visas in February.
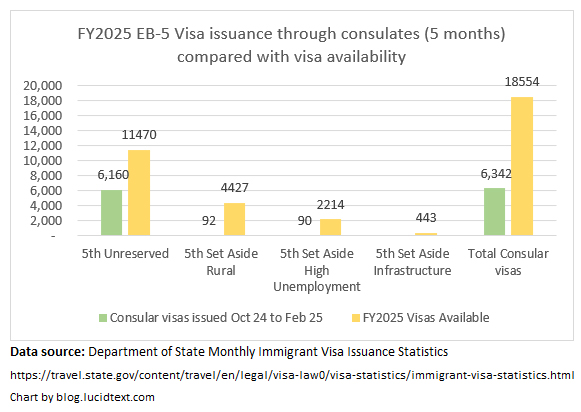
As someone alarmed by the EB-5 set-aside visa pipeline backlogs already accumulated as of 2024, I have had two hopes for 2025: high set-aside visa issuance and reasonably low new I-526E filings. I want to see as many as possible rural and high unemployment visas issued this year, taking a maximum bite from the backlogs, and I don’t want to see the timing outlook worsen considerably. But the reality seems to be otherwise. It appears that the Trump administration’s threats to EB-5 have not dampened but are actually spurring new EB-5 demand — contradicting my guesses from a couple weeks ago. And the latest published monthly visa issuance data (as of January 2025) shows set-aside visa issuance remaining extremely low, at least through consulates. The following chart illustrates the numbers informing my current impression that new EB-5 set-aside investors in coming months can likely still expect a “current” visa bulletin (due to distance between FY2025 visa availability and visa issuance so far) but may also face a dire wait for a visa number (due to distance between pipeline applicants and forthcoming visa availability overall). It’s so tough to make educated decisions when the visa situation is so dynamic, and lacking real-time data, but I keep trying to keep a sense of the big picture in view.
The April 2025 Visa Bulletin has retrogressed the EB5 Unreserved Final Action Dates for China and India, and concludes with a note indicating that Rest of the World Unreserved may also get a final action date this year.
E. RETROGRESSION OF EMPLOYMENT-BASED FIFTH PREFERENCE (EB-5) UNRESERVED FINAL ACTION DATES FOR CHINA AND INDIA
Increased demand and number use by China and India in the EB-5 unreserved visa categories, combined with increased Rest of World demand and number use, made it necessary to retrogress the final action dates to hold number use within the maximum allowed under the FY-2025 annual limits. Please note that it may also become necessary to establish a final action date for Rest of World countries if demand and number use continues to increase. This situation will be continually monitored, and any necessary adjustments will be made accordingly.
I read this announcement as good news for Unreserved visa wait times overall, since it means that the process is working efficiently. When I expected the process to work inefficiently, I thought that USCIS would slow-walk rest-of-world petition processing and consulates would slow-walk visa issuance, with the result that the visa bulletin would not need to move to add an extra constraint. Now I see that the visa bulletin is having to jump for Unreserved, which tells me that DOS has apparently already efficiently issued most EB-5 Unreserved visas available this year to China and India, while USCIS and NVC are maximizing the number of Rest of World applicants able to claim visas. ROW could only reach a limit this year if DOS manages to issue more ROW EB-5 visas this year than it ever has in the past. The more ROW visas issued this year, the fewer ROW applicants left for next year, so maxing out ROW visas this year would be good for ROW. However, high ROW visa demand directly corresponds to limits on China, so Chinese EB-5 applicants may receive thousands fewer visas this year than I had hoped.
As a reminder, I have estimated at least 8,100 pre-RIA ROW applicants in the pipeline for EB-5 Unreserved visas. This is greater than the number of visas remaining to ROW in FY2025 (given the 11,470 Unreserved visas available in FY2025, of which China has already absorbed over 2,500 and India can claim 803 under country caps). The ROW queue for Unreserved visas may also be expanded by post-RIA ROW investors fleeing from High Unemployment and Rural backlogs. Though this flight may be reversed, if and when ROW Unreserved gets a final action date while set-aside categories remain “Current.” (For earlier predictions of future visa bulletin movement for China and India, calculated as a function of demand/supply balance, see the “Pre-RIA China” and “Pre-RIA India” tabs in the EB-5 Visa Supply and Demand Analysis workbook linked to the EB-5 Timing page. I may now need to revise the Pre-RIA China tab with a more pessimistic estimate based on assuming more ROW visas/fewer China visas in FY2025.)
The April 2025 Visa Bulletin does not include a corresponding note for the EB-5 Set Aside categories, which suggests that USCIS and DOS are not working as efficiently to advance and issue visas to the High Unemployment and Rural backlogs.
(In other news, the spending bill to fund the government past March 15 appears to be not, after all, a potential vehicle for a new “Gold Card” or EB-5 changes. The House Appropriations Committee released a draft of the The Full-Year Continuing Appropriations and Extensions Act, 2025 on Friday, emphasizing that it contains “no poison pills or unrelated riders – the bill is simple: extend funding and certainty for the nation.”)
The EB-5 “investor visa” program obviously depends on visas. It’s tough to get a handle on the EB-5 visa outlook, considering spotty data, moving parts, and disincentives to recognize a threat. I keep working on analysis, because it’s so practically important for EB-5 issuers and investors to assess the visa incentive. I keep hesitating to publish, because conclusions are controversial and tough to fully qualify. But EB-5 is in a visa crisis that keeps getting more severe, and too dangerous not to address as best we can.
I’ve now updated the EB-5 Timing Page by publishing the current fruit of my on-going labor – a detailed Excel model that carefully patches together available facts, adds assumptions step by step, and builds a responsive model for assessing current backlogs and visa wait times. This article gives the tip of the analysis iceberg. For full detail you can download the EB-5 Visa Supply and Demand Analysis Excel model and make your way through it, following the sources and formulas and adjusting assumptions as needed to reach your own conclusions. As time permits, I may put up additional articles to discuss portions of the analysis in detail. And my paid timing consultations are now available again for those who’d like to discuss one-on-one.
EB-5 already has more pipeline visa applicants than annual visas in the Unreserved, High Unemployment, and Rural categories. This means retrogression coming in each category. I dare say that every analysis of available data leads to that general conclusion. The debatable question is who will be affected, when, and to what extent.
Table 1 gives an estimate of the total pipeline backlog going into 2025, while Table 2 gives the timing predictions that result from one detailed comparison of the existing backlog with forthcoming visa supply. As a base case, I populated the model with assumptions that I consider conservative, and erring on the side of optimism regarding processing speed and retention rates.
TABLE 1: Estimated EB-5 backlog size compared with supply as of FY25
China visa applicants (qualified or in the pipeline as of 10/2024)
India
Rest of World
Estimated total qualified plus pipeline visa applicants as of 10/2024
Compare visas available in FY2025
Compare annual visas available in FY2026 and beyond
Unreserved
33,300
3,200
8,100
44,600
11,470
6,800
Rural
3,900
1,050
1,275
6,225
4,427
2,000
High Unemployment
3,970
1,490
3,160
8,620
2,214
1,000
Infrastructure
?
?
?
?
443
200
Total
41,170
5,740
12,535
59,445
18,554
10,000
Key assumptions behind Table 1 estimates: an average 2-to-1 ratio of visas to I-526/I-526E filings for post-RIA investors (assuming average 2.5 family size and 80% approval rate), accurate NVC records for pre-RIA investors, and minimal visa-stage attrition. “Pipeline backlog” means qualified visa-stage applicants plus future visa applicants coming up from I-526/I-526E processing. Key data behind Table 1 estimate: NVC wait list as of May 2024, pending I-485 as of October 2024, pre-RIA I-526 pending as of July 2024, recent I-526 denial rates and family sizes, post-RIA I-526 and I-526E filed through September 2024, post-RIA filings by country and category through July 2024.
TABLE 2: EB-5 timing estimates
Who may get a visa in FY2025? (optimistic best-case scenario for China and India)
Estimate for when an investor with a 2025 priority date might expect a visa number in this category
Unreserved China
Priority dates up to September 2016 (best case for China assuming ROW visas are limited by processing constraints)
After 2033 (considering the existing pre-RIA backlog and assuming that ROW demand continues neither much higher nor much lower than in 2024)
Unreserved India
Priority dates up to July 2019 (assuming FIFO order)
After 2030 (considering existing pre-RIA backlog)
Unreserved ROW
Up to 9,800 applicants in theory, but likely about 4,000 due to processing constraints
After 2026 (considering existing pre-RIA backlog)
Rural China
Priority dates up to March 2024 (best case if maximum FY25 visas issued, and no visa bulletin limit until year-end)
2032 (assuming maximum FY25 visas issued, and that ROW demand continues as in 2024)
Rural India
Priority dates up to March 2024 (best case if maximum FY25 visas issued, and no visa bulletin limit until year-end)
2029 (assuming maximum FY25 visas issued, and that ROW demand continues as in 2024)
Rural ROW
Whichever priority dates can get processed in time to claim a FY25 visa
As soon as processing times permit
High Unemployment China
Priority dates up to April 2023 (Best case if maximum FY25 visas issued, and no visa bulletin limit until year-end. November 2022 would be worse case if ROW visas can be maximized.)
After 2033, when pre-RIA Unreserved backlog clears making Unreserved visas also available to post-RIA applicants (theoretical worst-case if HU investors limited to HU visas: 2102)
High Unemployment India
Priority dates up to April 2023 (Best case if maximum FY25 visas issued, and no visa bulletin limit until year-end. November 2022 would be worse case if ROW visas can be maximized.)
After 2030, when pre-RIA Unreserved backlog clears making Unreserved visas also available to post-RIA applicants (theoretical worst-case if HU investors limited to HU visas: 2053)
High Unemployment ROW
Priority dates up to May 2023 (Scenario if F25 visas are FIFO with no visa bulletin limit on China/India. January 2024 would be best case for ROW if swift processing allows maximizing ROW visas in FY25)
After 2026, when pre-RIA Unreserved backlog clears making Unreserved visas also available to post-RIA applicants (worst-case if limited to HU visas is 2030)
Infrastructure
Unknown
Unknown
Key assumptions behind Table 2 base estimates: That all available FY2025 visas will be issued, with no limits imposed yet on China or India Rural or High Unemployment in FY2025. (In the likely event that this optimistic assumption is not realized, worse visa wait times would result for China and India.) That the backlog entering FY2025 is as described in Table 1 (and as detailed by priority date in the supporting Excel). That new EB-5 demand in 2025 and future years will mirror the volume and TEA/category distribution of EB-5 demand in FY2024. (To the extent that this proves not true, actual wait times for China Unreserved, China Rural, and India Rural could be less than estimated in Table 2.) That qualified Rest-of-World High Unemployment and Rural applicants are likely to take High Unemployment and Rural visas at least in 2025 (considering that they are first-in-line for Rural and HU visas while thousands of earlier pre-RIA ROW applicants still stand in the way of access to an Unreserved visa), but that Rural and High Unemployment investors from all countries are likely to request/be assigned Unreserved visas as soon as the pre-RIA Unreserved visa backlog clears for their country. That visas are generally assigned in priority date order. (As discussed in the previous post, exceptions to this general rule mean that individual experience can turn out to be faster or more delayed than the average, even assuming that the times in Table 2 are on-target as averages.)
Table 3. Potential annual additions to the EB-5 pipeline backlog (if current/future years mirror the number of I-526/I-526E filings in FY2024)
China
India
ROW
Total estimated new pipeline visa applicants resulting from one year of investments (FY2024)
Compare annual visas available in FY2026 and beyond
Unreserved/Other
100
50
150
300
6,800
Rural
2,600
700
1,000
4,300
2,000
High Unemployment
2,200
800
1,800
4,800
1,000
Infrastructure
?
?
?
?
200
Total
4,900
1,550
2,950
9,400
10,000
Tables 1 and 3 highlight the basic EB-5 visa predicament: that we’re in a deep and rapidly deepening visa hole. EB-5 entered 2025 with about five times more pipeline visa applicants than base annual visas. 2024 alone brought in 2.3x as many Rural investors and nearly 5x as many High Unemployment investors as can reasonably get visas in a year with their families in a normal year under category limits.
Table 2 summarizes attempts to quantify when investors could dig out of that hole and secure visas. (See individual tabs in the Excel model for sources and derivations for the estimates in this table. And you can use the worksheets to try the effect of different assumptions.)
Table 2 is a reminder that if something doesn’t give, the only new EB-5 investors in 2025 who can expect to get a green card this decade may be Unreserved and Rural investors from “Rest of World” countries, and possibly Rural investors from India. The supply/demand imbalance in High Unemployment is already large enough to create retrogression for applicants from every country in 2026 (or earlier if USCIS increases processing volume), and to measure theoretical wait times for China and India in lifetimes (though less in practice assuming Unreserved visas can be allocated to post-RIA investors as soon as the pre-RIA Unreserved backlog clears).
Could actual wait times be even worse than the Table 2 estimate? Theoretically yes, if low-volume I-526/I-526E processing continues to hinder visa issuance, if on-going Rest-of-World visa demand increased from 2024 levels, and if family sizes and/or approval rates beat historical averages.
Actual visa wait times could also turn out less than estimated in Table 2, so long as visa demand proves less or supply proves greater than modeled in the Excel workbook. Maybe thousands of the pre-RIA China and India applicants registered at the National Visa Center have withdrawn or will give up or get denied, thus hastening the day when post-RIA applicants can start to access Unreserved as well as set-aside visas. (Visa Bulletin dates may signal this possibility for India – I’ll be interested to see the forthcoming updated NVC waitlist.) Maybe recent applicants will prove to have a high rate of project and/or evolutionary failure, resulting in a visas-to-I-526E ratio of much less than 2.0 for Rural and High Unemployment. Maybe the EB-5 market will shortly collapse over uncertainty around visas, sustainment, and reauthorization, thus stemming the incoming tide of Rest-of-World demand that would otherwise limit future visa supply to China and India. Or maybe politicians will realize that they love the visa category that has given the U.S. innumerable jobs, measurable economic growth, and immigrants such as Elon Musk, and decide to allocate more visa numbers to EB-5.
As illustrated in Tables 1 and 3, stabilizing the EB-5 visa situation could require a one-time infusion of around 40,000 visas to clear the existing backlog, or alternatively about 2.3x more rural visas and 4.9x more high unemployment visas on an annual basis to support ongoing demand potential. There were just under 5,000 EB-5 investments made in 2024, which could be nearly sustainable for a program with 10,000 annual visas — if not for the EB-5 backlog blocking paths for new investors and blocking access to 68% of those visas. Alternatively, wait times could stabilize at a tolerable level (for those few who can persist) if the EB-5 market contracts by at least half, and/or about half of past Unreserved and High Unemployment investors give up.
Something is certain to give, when theoretical wait times become intolerably long. Consider this exercise: “100 people arrive for breakfast at a restaurant that can serve 20 customers per hour. How long will customer #101 wait for breakfast?” The real-life answer is not “100/20=5 hours” but rather “however long she/others are willing to wait for breakfast before giving up and going to eat somewhere else.” Ideally the restaurant owner is smart enough to rustle up more staff and tables in time to accommodate the profitable crowd, and to avoid discouraging new customers.
In cell D42 of the HU tab of the model, you’ll find a formula 5,252/70=75. The China high unemployment pipeline backlog is on track to be 75x greater this year than annual HU visa supply under country caps. But of course, no Chinese HU investor will wait anywhere near 75 years for a visa. The gap between demand and supply will inevitably close somehow, to reduce wait times to tolerable levels. I sincerely hope that supply-side relief is what ultimately closes the gap, making many more visas available across categories such that HU investors from all countries can get timely access to a HU or Unreserved visa. But for now, please “mind the gap” or risk unexpected failure.
As time permits, I may write additional posts to discuss the methods and thinking baked into the Excel model behind this post, and to walk through using and modifying the model. As time permits, I may redo the model when Department of State publishes the November 2024 NVC Waitlist and the 2024 Report of the Visa Office, and as new processing reports from USCIS and DOS help clarify possible visa issuance this year. If you benefit from the considerable effort that I’ve put into this otherwise thankless analysis, please consider making a contribution to support the work. If you’d like to pay for a consultation to discuss the model and your EB-5/timing questions individually, please book a meeting here.
I would like to thank Lee Li of IIUSA, Connor Chen of EB5 Sir, and Joey Barnett and Charlie Oppenheim of WR Immigration for responding to my requests for advance review of this analysis. And I welcome any additional corrections and feedback to the EB-5 Visa Supply and Demand Analysis model. You can email me at suzanne@lucidtext.com.
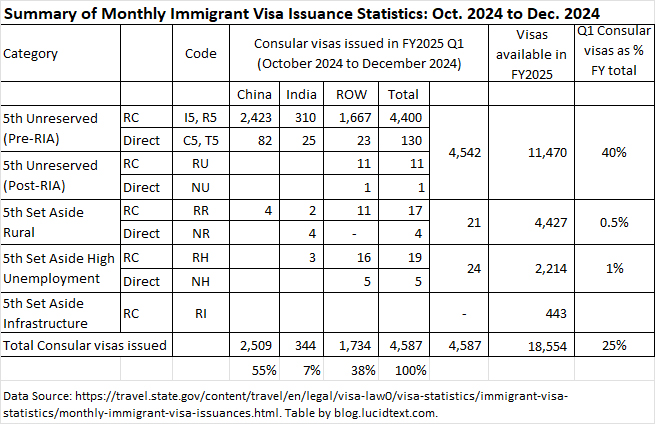
Department of State has also been updating its data, with monthly immigrant visa issuance reports now published for the first quarter of FY2025 (October, November, and December 2024). While my previous post focused on adjustment of status visas so far this year, the DOS numbers show what’s been happening with consular processing. As illustrated in the summary table below, DOS did great work with Unreserved visa issuance in the first quarter, managing to issue 40% of Unreserved visas available for the year. Chinese applicants particularly benefited from this efficiency. I’m also delighted to announce, for the first time, visas issued in almost every new post-RIA category (only missing infrastructure). However, the set-aside numbers are low. Rural and high unemployment visa issuance at consulates in the first quarter barely reached 1% of visas available this year. With AOS numbers apparently low so far as well, this makes me question whether/when FY2025 limits in those categories could possibly be reached. If this low volume continued, it would mean deferring set-aside retrogression in the visa bulletin (giving more “C” months for filing AOS), wasting some FY2025 set-aside visas, and pushing more of the existing backlog into future years. I trust that we’ll see much higher issuance numbers in coming monthly reports, to get as many set-aside applicants as possible into FY25’s unusually high visa limits.
Last year, USCIS started publishing a valuable monthly report titled “Pending Applications for Employment-Based Preference Categories.” As explained on the AOS FAQ page, “The report provides our estimate of how many Forms I-485 we have in our inventory for each employment-based preference category, by selected country of chargeability, and by the month and year of the estimated priority date.”
I look to the pending I-485 reports for detail on the EB-5 inventory by TEA category, and for evidence of EB-5 processing movement. This post compares the EB-5 I-485 inventory report as of October 3, 2024 (the start of FY2025) with December 3, 2024 (the most recent report). I’m struck by the large number of applicants for reserved visas, by hints of I-526E processing progress by priority date, and by evidence that adjustment of status visas are not necessarily being issued in order by priority date.
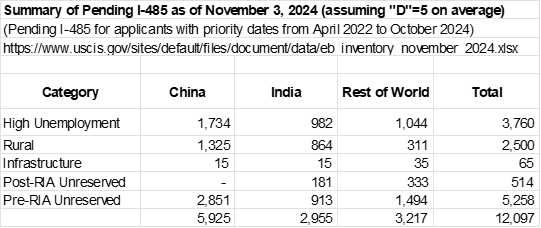
Table 1 summarizes the USCIS report of EB-5 I-485 pending as of December 3, 2024. Note that the numbers represent every EB-5 applicant with a pending I-485, including applicants who can’t claim visas yet because the underlying I-526/I-526E has not yet been approved. The USCIS report has “D” in some cells to represent a redacted number less than 11; the figures in Table 1 assume that D=5 on average.
Table 1. EB-5 I-485 Pending as of December 3, 2024 (assumes “D”=5 on average)
Category
China
India
Rest of World
Total
High Unemployment
1,807
1,034
1,075
3,916
Rural
1,396
907
350
2,653
Infrastructure
15
15
40
70
Post-RIA Unreserved
–
15
179
194
Pre-RIA Unreserved
2,976
882
1,362
5,220
Total
6,194
2,853
3,006
12,053
In Table 1, I note that Infrastructure investors exist (despite not being recorded on FOIA reports of I-526E filings), and the numbers of high unemployment and rural applicants. If the pending high unemployment I-485 applicants could all get I-526E approval and qualify for visas this year (with 2,200 HU visas available), then we’d have high unemployment retrogression in the visa bulletin for all countries, including Rest of World countries – and that’s not even counting all the HU applicants coming up separately through consular processing.
The USCIS pending I-485 report uses one label for all Unreserved EB-5, but in Table 1 I divided the Unreserved applicants based on priority date into pre-RIA (through March 2022) and post-RIA (after March 2022). This highlights the fact that — so far — not many post-RIA applicants are requesting Unreserved visas. This may change when ROW applicants who qualify for High Unemployment visas find themselves retrogressed in the crowded HU queue for only 10% of EB-5 visas, and opt to queue up instead behind the pre-RIA Unreserved ROW applicants going for 68% of EB-5 visas.
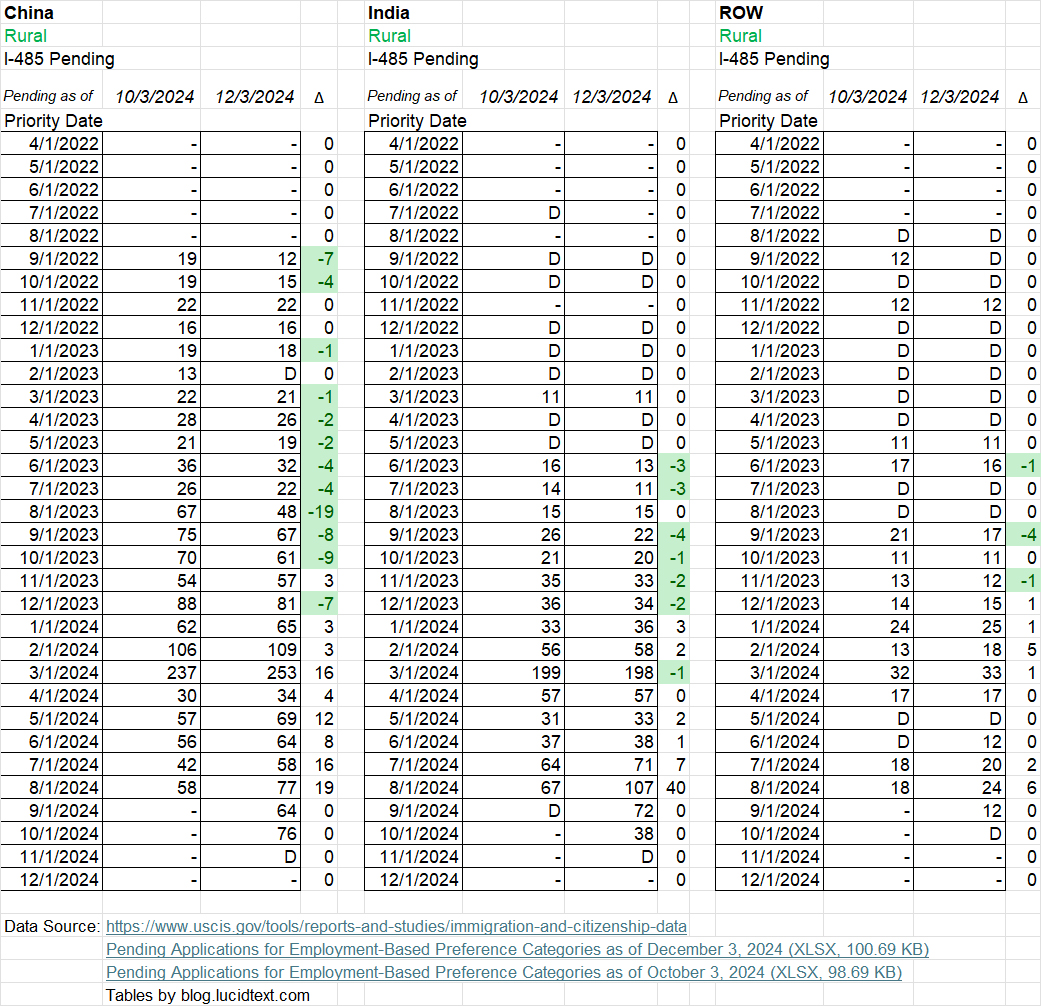
And now, on to more detailed tables that compare the December 3, 2024 report with the October 3, 2024 report. Looking at inventory changes, I can make some inferences about what happened with EB-5 processing in the first two months of FY2025.
Looking at changes to the Rural I-485 inventory between October and December, I can tell that USCIS has at least been adjudicating Rural I-526E with priority dates up to December 2023. (I-526E approval precedes I-485 approval.) I also note that the inventory isn’t being cleared FIFO in priority date order. Over a wide span of priority date months, we see a few I-485 being cleared while others in the same month get left untouched. I will guess that this lack of FIFO discipline originates with I-526E processing, where order depends on I-956F timing and not just filing date. Mandamus actions may also play a role. I recently heard reports from investors with November 2023 and March 2024 priority dates who got I-485 approval in January 2025 – six months after I-526E approval, and two months after having Mandamus actions filed for their I-485.
Looking at changes to the High Unemployment I-485 inventory between October and December, I can’t tell that USCIS has moved much beyond 2022 priority dates with I-526E processing. Most HU I-485 visas issued so far this fiscal year were to 2022 PD, with just a handful 2023 and later PD getting visas so far. The delta column in each table doesn’t capture all processing activity, since it’s just the difference between additions and subtractions to the inventory by priority date month. But overall, I get the impression that I-485 approval numbers have been quite low so far this year for high unemployment, and not FIFO.
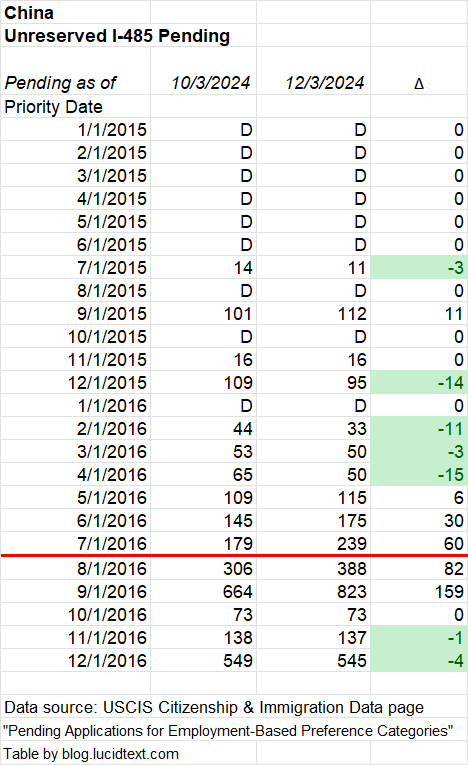
Changes to the Unreserved I-485 pending inventory likewise do not suggest a FIFO situation. What made those 15 Chinese I-485 applicants with April 2016 priority dates so lucky to be cleared, even as 50 others with priority dates in the same month and at least 337 other Chinese from previous months were left untouched? It’s possible that the change reflects withdrawal rather than approval, but still I wonder.
The pattern illustrates why we need to qualify EB-5 timing prediction for individual cases. A model can estimate how long it will take to issue visas to everyone with April 2016 priority dates, as a function of visas available and the total number of people waiting up to that date. But the model doesn’t know if Investor X will have the luck to be picked out earlier than others, or somehow left behind. At the same time, the pattern shows why we can’t conclude that backlogs have been cleared just because some recent priority dates are getting visas. Apparently two Indian applicants with December 2021 priority dates left the I-485 inventory recently – but that doesn’t erase over 500 Indian applicants with earlier priority dates whose I-485 are still pending.
I’m about to publish my best effort at a comprehensive analysis of the current EB-5 backlog and timing outlook, but wanted to first publish this article to highlight the key issue of order in visa processing.
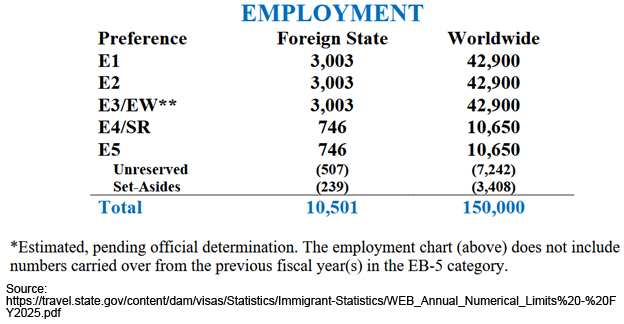
Department of State has just updated the Immigrant Visa Statistics page with Annual Numerical Limits for Fiscal Year 2025. As expected, there are an estimated 150,000 total EB visas available for FY2025 (only slightly above the 140,000 baseline, as consular operations have mostly recovered from the Pandemic). EB-5 gets 7.1% of new EB visas, or about 10,650 in FY2025, plus carryover visas.
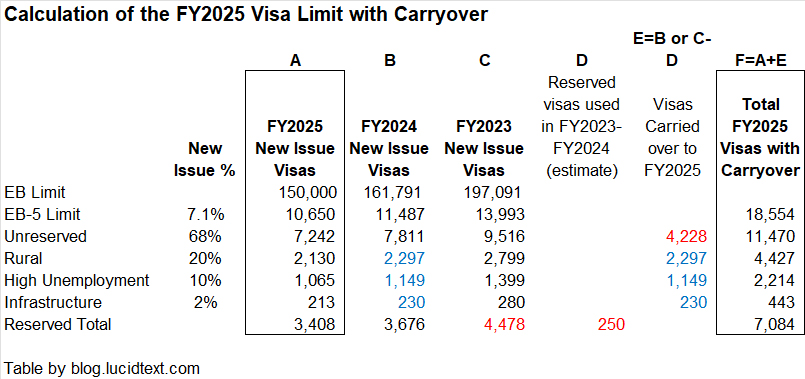
According to EB-5 carryover rules, the FY2025 Reserved limit will be increased by Reserved visas that were newly-issued but not used in FY2024, while the Unreserved limit will be increased by Reserved visas that were newly-issued in FY2023 and then not used in 2023 or 2024. Here’s how I calculate the FY2025 total including carryovers.
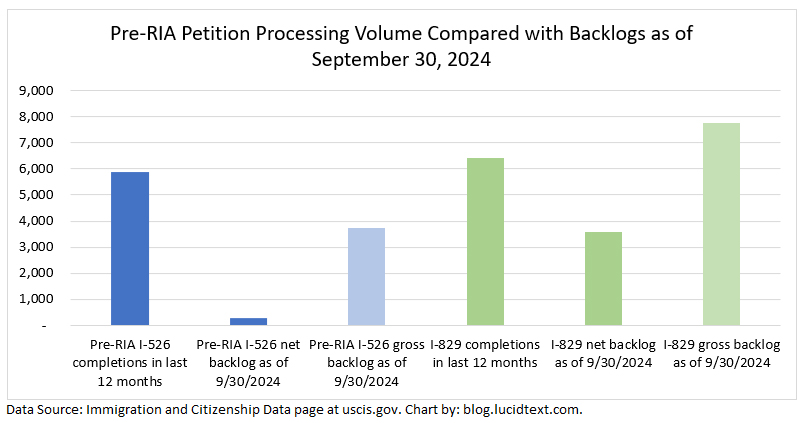
We’ll have our eyes particularly on the approximately 4,400 Rural Visas and approximately 2,200 High Unemployment visas available this year. The race is on for USCIS to approve enough of the 3,000+ pending Rural I-526E and 4,000+ pending High Unemployment I-526E to generate applicants for this year’s visas. See also my post on the latest Q4 adjudication numbers and receipt data and my analysis of family sizes in EB-5. (These important new articles were inadvertently not emailed out upon publication).
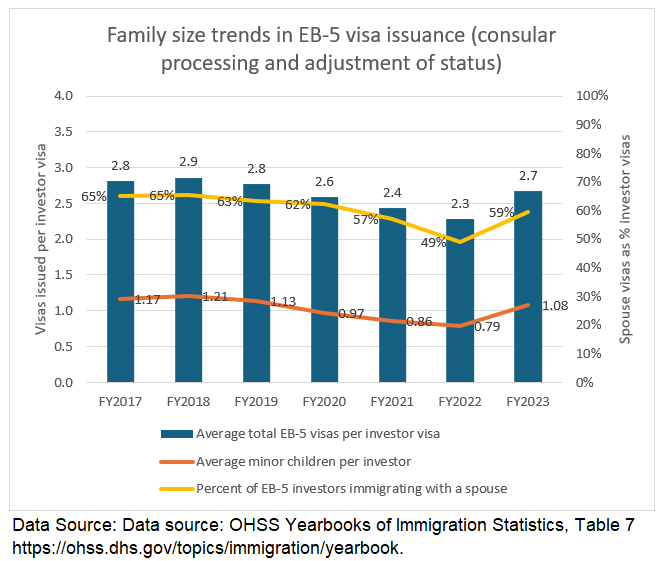
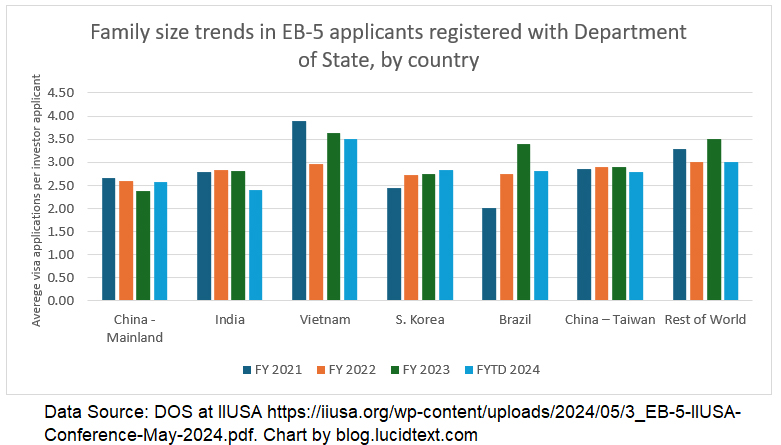
In the spirit of the holidays, I’m sharing a few data-rich charts on the topic of EB-5 family sizes. How many EB-5 investors even have families, on average? It’s a critical and controversial topic, because EB-5 visa availability depends on how many visas go to spouses and children. The estimated market size for EB-5 investment can vary by a factor of three, depending on whether each EB-5 investment absorbs closer to one visa or three visas. The EB-5 backlog is either catastrophic or not-too-bad, depending on the multiplier used to convert I-526E receipt numbers to an estimated number of family vises.
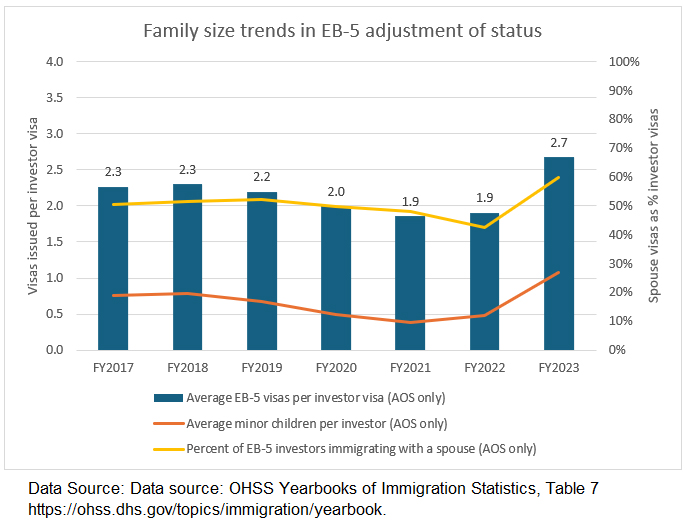
It’s dangerous to generalize from limited samples and personal experience, because EB-5 investor family size numbers have varied by country, by immigration path, and over time. Government data is available from two sources. The annual Yearbook of Immigration Statistics counts the EB-5 visas issued to principals, spouses, and children through status adjustment and to new arrivals. The Department of State periodically provides tables showing the percent of principals (investors) among EB-5 applicants registered at the National Visa Center. I made charts showing the past seven years of EB-5 data from the Yearbook of Immigration Statistics, and illustrating the most recent report from Department of State for all applicants in the NVC inventory (from Slide 6 of the May 2024 DOS IIUSA conference presentation).
The charts illustrate trends and variation, and set some guardrails. You can examine them for yourself, and draw your own conclusions. Looking at the charts, I’d say it’s clear that 1.5 is too low and 3 is too high to use as the number for average EB-5 family sizes. From 2017 to 2023, 2.6 was the average total EB-5 visas per investor visa. The seven-year average was higher for EB-5 investors abroad (2.9) than for U.S.-based investors (2.2), but the gap narrowed during the period. Maybe consular visas have steadily fallen over time due to children aging out, while adjustment visas show an upward trend as young investors start to build families. I don’t know the story behind the Pandemic-adjacent dip in people immigrating together with spouses. Looking at the country-specific differences in NVC data, we can guess about the impact of shifting the EB-5 market from one place to another.
The NVC data has the limitation of covering consular processing only, but the strength of covering the current population of applicants for future visas (including set-aside applicants with priority dates through 2024). The Yearbook data covers historical visa issuance only, but it reports on status adjustment as well as new arrivals from consular processing.
For my post-RIA EB-5 backlog estimates, I have been using 2.0 as the minimum multiplier to convert I-526 filings to estimated EB-5 visa demand. I don’t feel justified going any lower than that given the data on family sizes in the current EB-5 inventory and historical visa issuance, as detailed in the charts below. Estimated failure rates are another factor in the multiplier, but we should hesitate to count on high failure rates for Pre-RIA investors. “Don’t worry about the backlog because most of them will probably fail” is not a good sales pitch.
We should keep reminding Congress that the economic impact of EB-5 could be so much bigger, if family members didn’t get counted against the EB-5 visa limit. Does Congress realize that under current rules, fewer than 4 out of 10 of the visas designated to incentivize investment can actually go to investors?
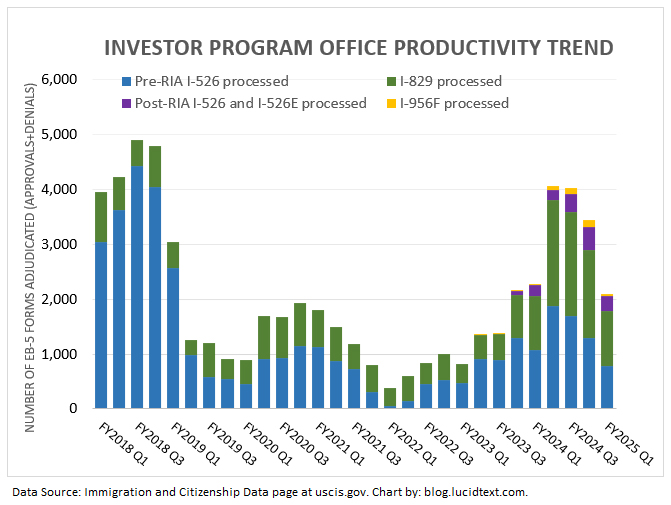
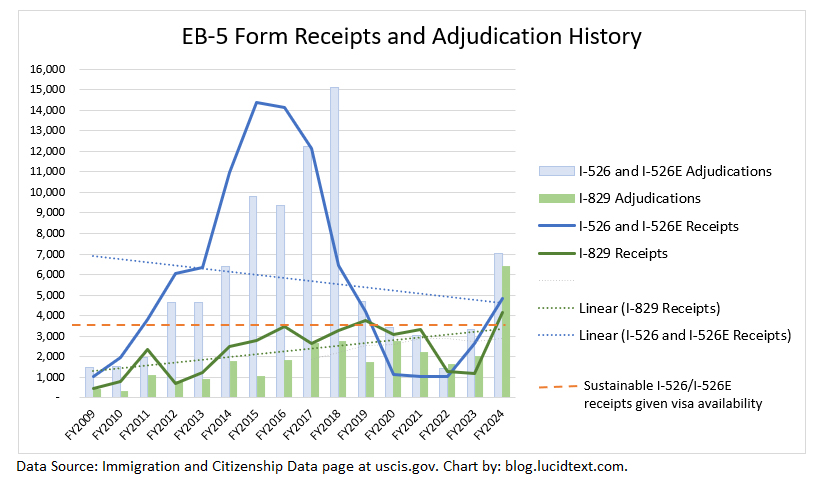
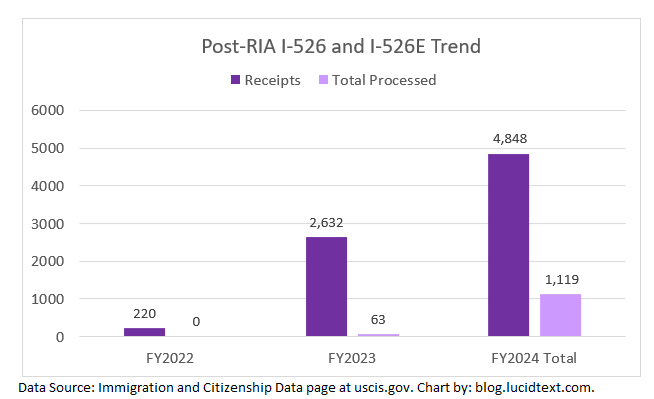
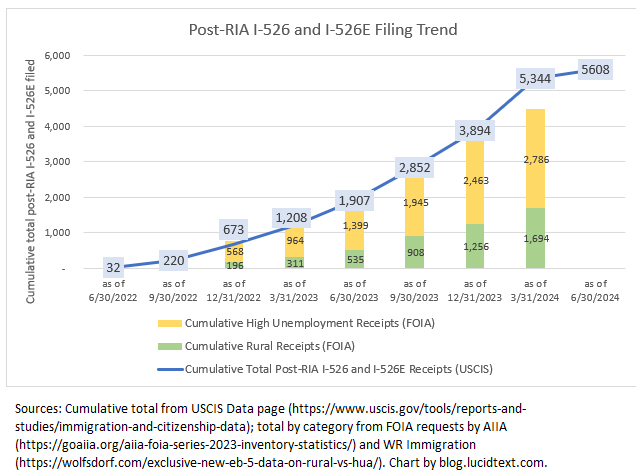
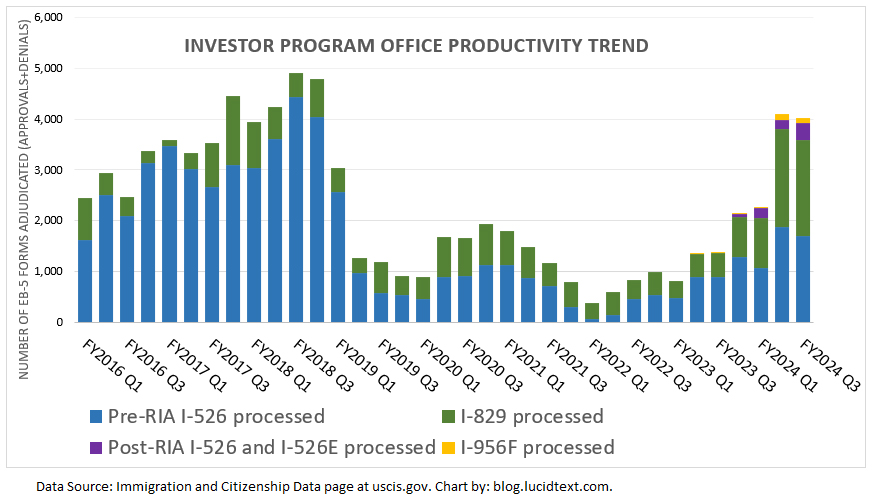
USCIS has finally updated the Citizenship and Immigration Data page with form receipt and adjudication numbers through September 2024, the end of the fiscal year. The numbers continue to show encouraging EB-5 processing improvements and robust but sadly unsustainable EB-5 demand.
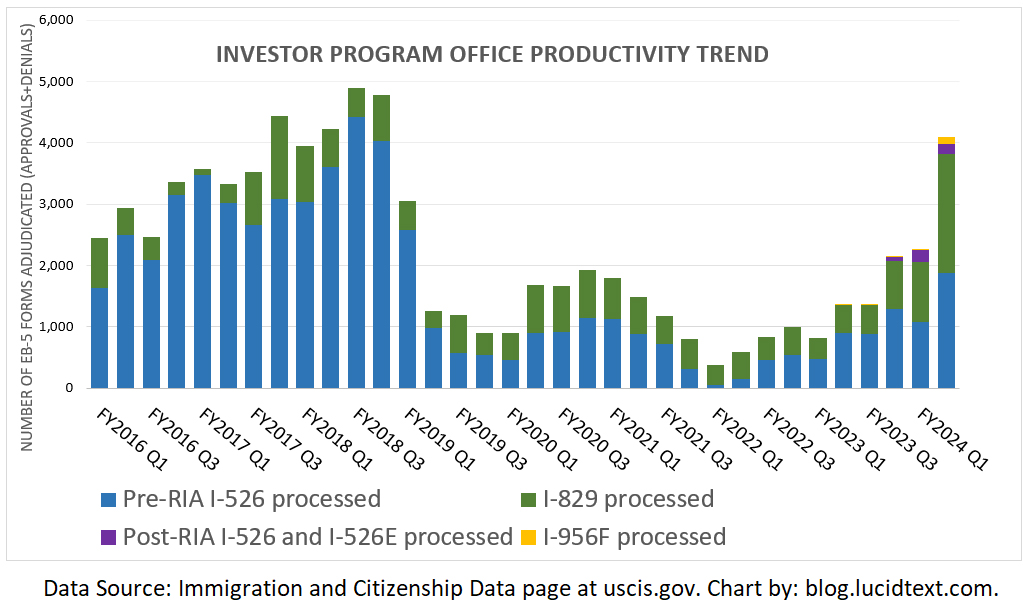
I put the FY2024 data in context of the fifteen years since I launched my business plan writing service and started blogging about EB-5.
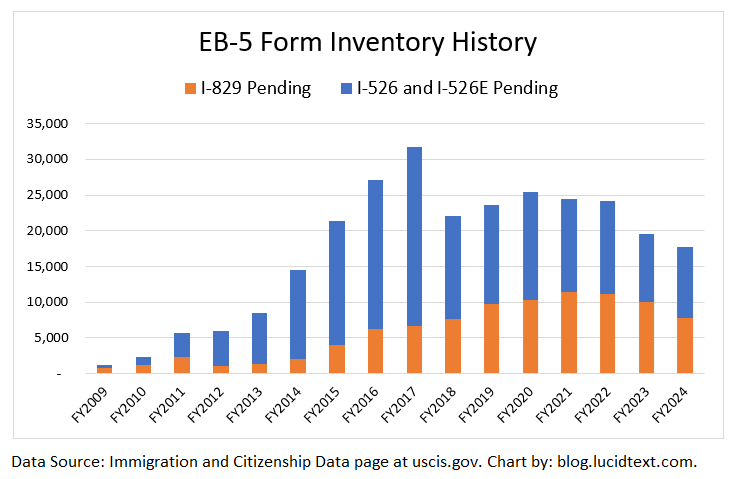
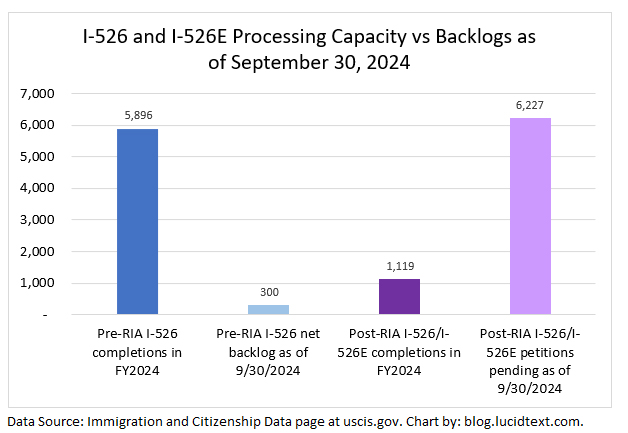
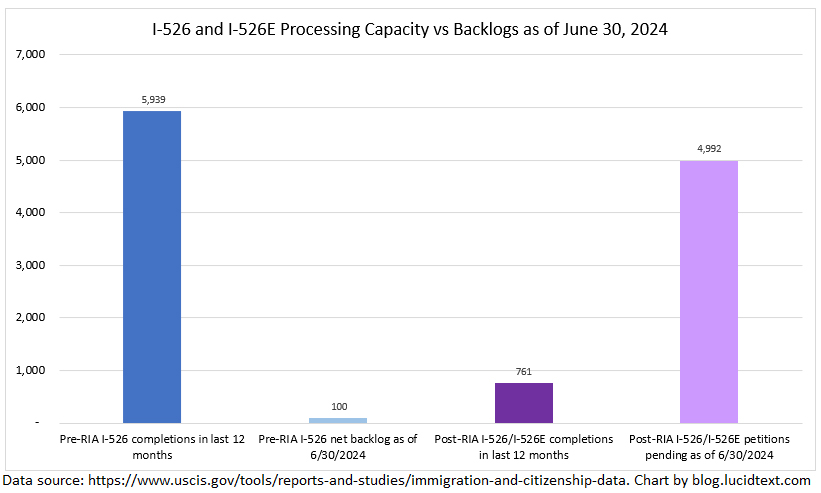
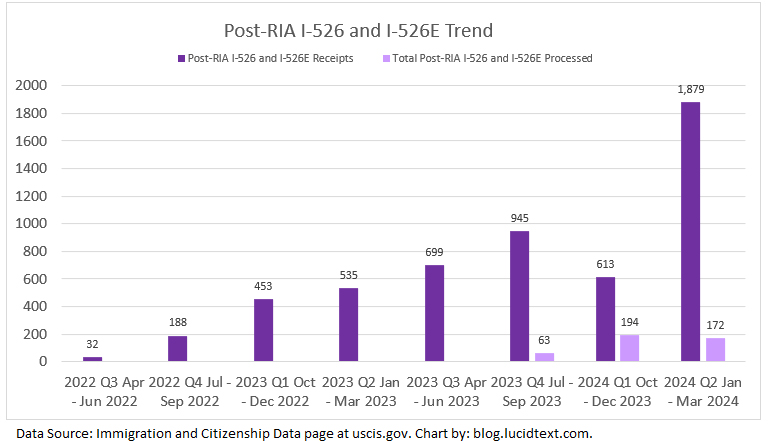
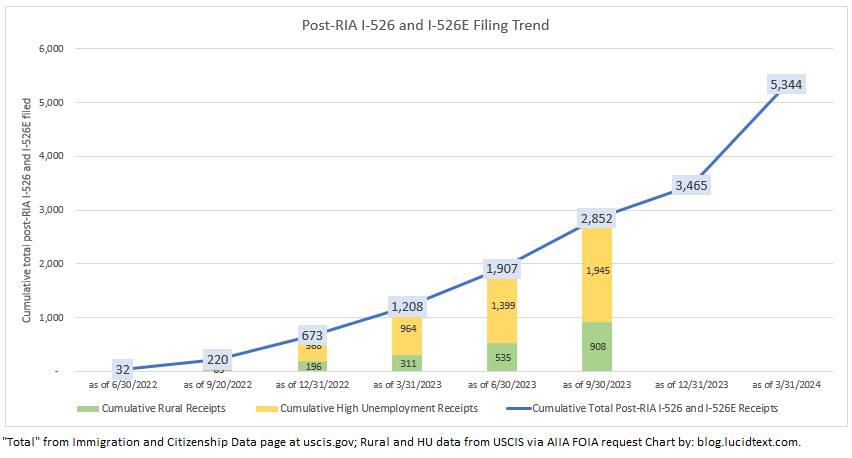
The chart shows that USCIS just had its best EB-5 processing year since 2018. EB-5 form completions more than doubled from the previous year, and reduced the I-526 and I-829 backlog to the lowest level since before 2015. USCIS also managed to process 1,119 post-RIA I-526 and I-526E, thus generating a significant number of applicants for set-aside visas in 2025. If the processing capacity applied to pre-RIA I-526 in 2024 is moved to I-526E in 2025 (as it might be, considering that the net backlog for I-526 is only 300 forms), then nearly all currently-pending I-526E could be processed in 2025. This is the good news.
Meanwhile, I-526E receipts in FY2024 reflect EB-5 demand at its highest level since before 2019, and once again shooting above the level possible to accommodate under the EB-5 numerical limit (i.e. about 10,000 visas annually, of which historically an average 38% go to investors while the rest to go spouses and children). Incoming EB-5 demand is largely aimed at the fraction of visas in set-aside categories, and lacks an escape route since Department of State is still working through the legacy Unreserved visa backlog generated by excess EB-5 demand from 2012 to 2019, as illustrated in the above chart. When the Unreserved backlog disappears (which I calculate could happen by 2030), thus clearing the way for post-RIA applicants to access Unreserved as well as Set-Aside visas, the 10,000 annual visa limit would still not be sufficient to accommodate new investors coming in at a rate of nearly 5,000 per year, as happened in FY2024.
The above chart illustrates that EB-5 needs, overall, about 30% more annual visas than it has, in order to close the gap between actual/potential and sustainable demand. (If we drilled down to historical imbalances by country and TEA category, the gap would be greater than 30% in some cases and less in others.) If the visa demand gap isn’t closed by increased visa supply, it will be closed by plummeting EB-5 usage when prospective investors see the gap producing backlog delays.
I am committed to doing whatever I can to support relief from the current unsustainable situation in EB-5, whether that be any possible EB-5 visa relief, or measures to make visa wait times more tolerable. I have been in advocacy conversations about legislative options, and have tried to support data and education to make visa wait times at least more understandable and predictable. I oppose measures such as the IIUSA sustainment lawsuit that would make visa wait times more painful and unattractive by linking repayment timing to visa timing for post-RIA investors. I also made the tough decision this year to stop writing regional center EB-5 business plans, given my backlog analysis, though that work had been my bread and butter for over a decade. Not that my small professional sacrifice will make a difference, but it reflects how seriously I take the current EB-5 backlog problem. I don’t want to help dig the hole deeper, and I hope for the day when EB-5 can become sustainable — which it may, if many people take the current problem seriously. Immigration opportunity in exchange for economic development and job creation is a beautiful thing, when it’s real. EB-5 investment has supported so many good projects and business ideas, and it needs to be able to realize its immigration promise to investors, including investors from China and India.
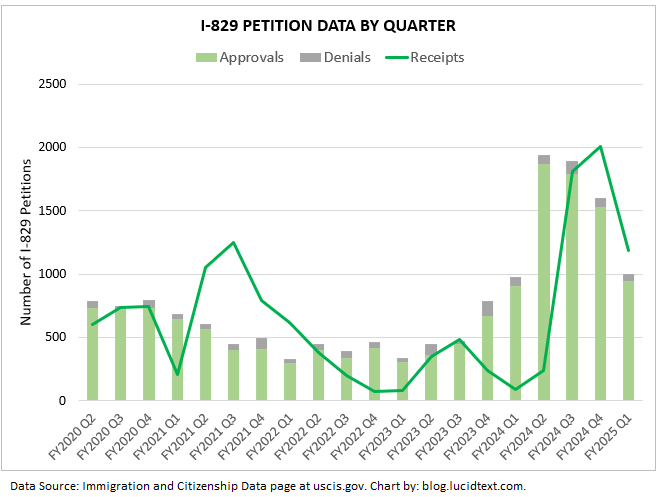
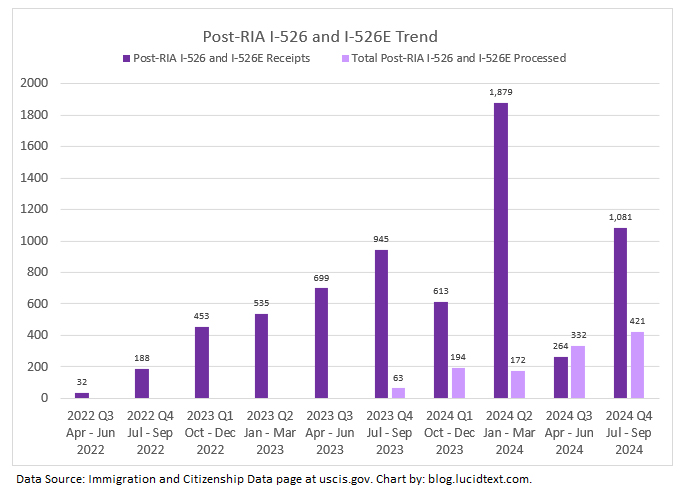
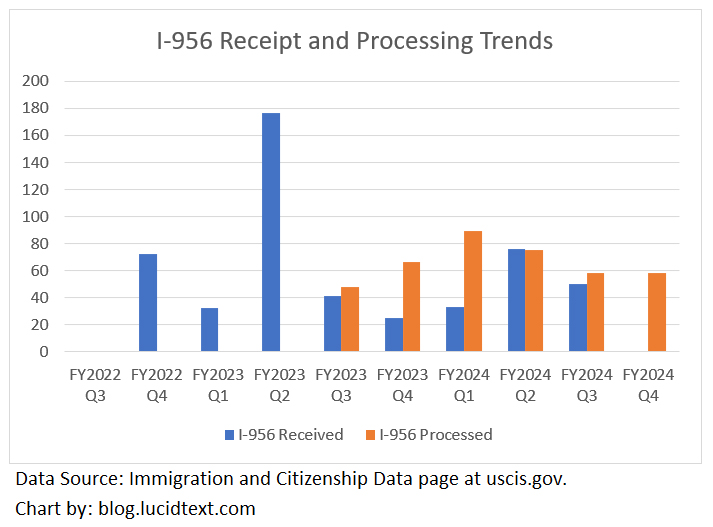
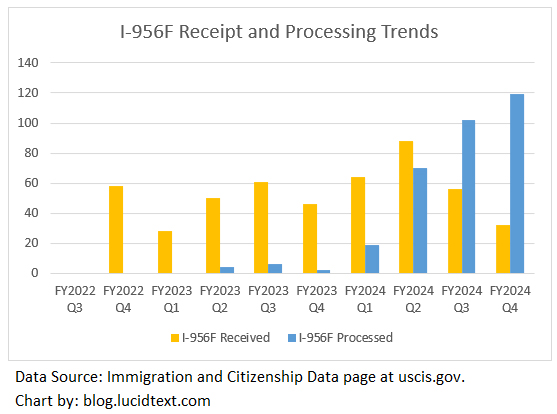
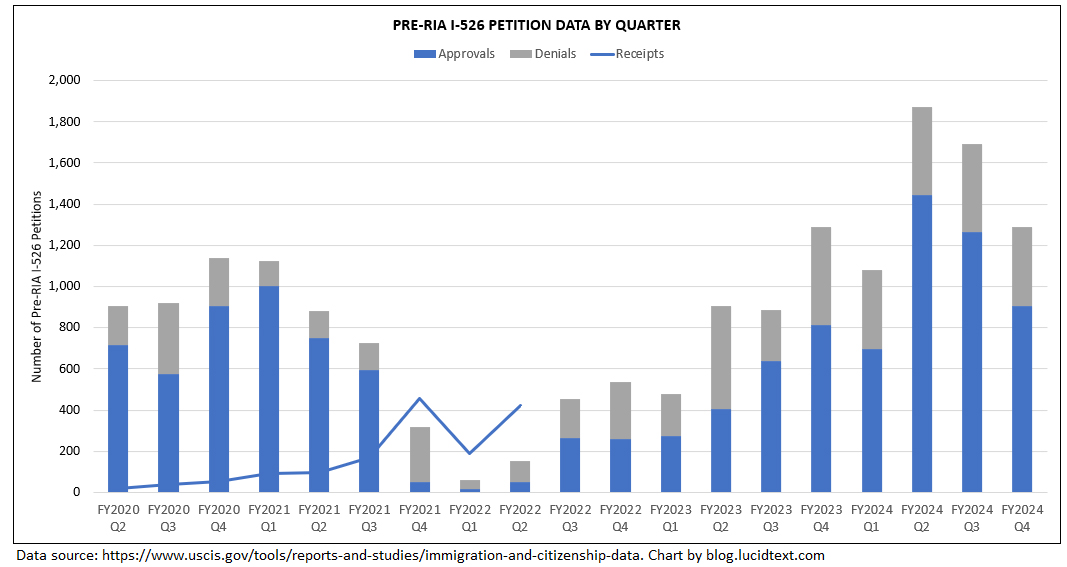
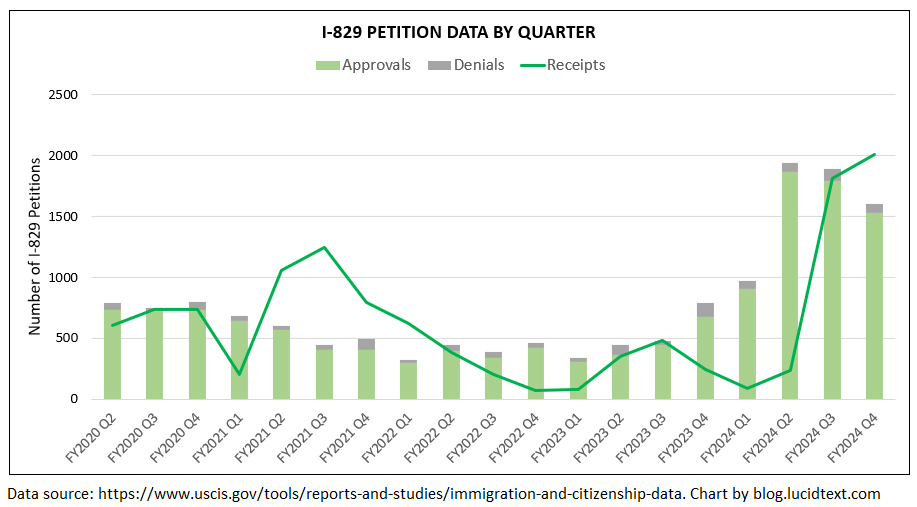
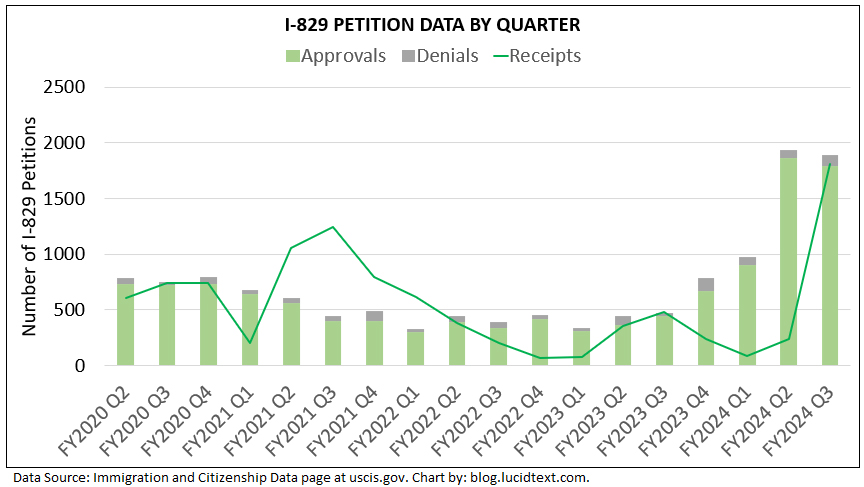
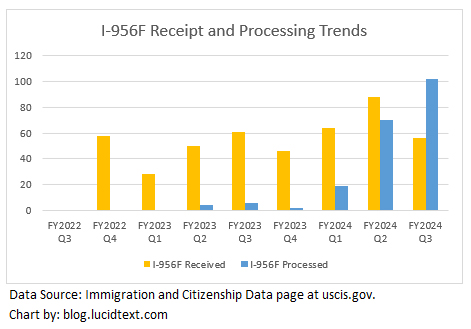
And now for a full set of charts for the FY2024 Q4 data. I notice that I-956 and I-956F receipts have been falling while adjudication volumes continue to grow – an interesting industry phenomenon and a good sign for processing times. I-829 receipts reached an unprecedented high this year. Are people increasingly removing conditions individually rather than as families with the principal applicant? Denial rates remain very low for post-RIA forms and I-829, and elevated for legacy I-526. I included a summary table for the pending I-485 inventory as of November 2, 2024, showing over 12,000 EB-5 adjustment forms pending. And I note that Department of State has also published the first month visa issuance report for FY2025. Only 6 post-RIA visas were issued through consular processing in October 2024 (3 high unemployment, 2 rural, and 1 unreserved), but the Visa Bulletin suggests that Department of State expects this pace to increase shortly. I’ve also updated my Processing Data page with the Q4 data.
We’ve known that EB-5 set-aside visa retrogression is coming, but not when. Excess demand has been evident in data for I-526 and I-526E receipts for High Unemployment and (soon) Rural categories. (AIIA just published a FOIA response based on a September 2024 query, and before that we had the IIUSA FOIA data queried in July 2024, the WR Immigration FOIA data queried April 2024, and AIIA’s FOIA of 2023 data.) But when will high unemployment and rural investors reach the visa stage with their families in sufficient numbers to max out available visas? I had predicted that sluggish USCIS processing might slow-walk the backlog and keep the Visa Bulletin “current” through 2025 for EB-5 set asides. However, USCIS has apparently accelerated the volume of petition processing since last report in June 2024. The January 2025 Visa Bulletin includes a note with this warning signal for potential retrogression this year.
E. VISA AVAILABILIY IN THE EMPLOYMENT FIFTH PREFERENCE (EB-5) SET ASIDE CATEGORIES
The Department of State and USCIS note increased I-526E petition approvals, and both agencies see increasing numbers of individuals processing their applications to completion in the EB-5 set aside categories. It may become necessary to establish Dates for Filing and Final Action Dates during the fiscal year to ensure that issuances in these categories do not exceed annual limits. This situation will be continually monitored, and any necessary adjustments will be made accordingly.
—
Is this announcement significant? What changes, when the Visa Bulletin changes and imposes cut-off dates?
Let’s start with what doesn’t change: visa bulletin retrogression does not make expected visa wait times longer than they were already. A high unemployment investor with an August 1, 2024 priority date has a wait time that’s a function of the 3,995 other high unemployment investors who have earlier priority dates, and who will be joining their spouses and children to compete for available HU visas (2,200 or so visas this year, and 1,000 annually thereafter). A rural investor with an August 1, 2024 priority date has a wait time that’s a function of the 2,809 other rural investors who have earlier priority dates, and who will be joining their spouses and children to compete for available HU visas (4,400 or so visas this year, and 2,000 annually thereafter). The picture is a bit complicated by the fact that expected wait times for Chinese and Indians can be increased over time by subsequent Rest of the World investors, while ROW investors benefit when the Visa Bulletin limits China and India. But basically, an investor’s visa wait time originates in the demand/supply balance on the day he joined the back of the visa queue by filing I-526E. The wait time is not created or changed on the day that the front of the visa queue exceeds annual limits and triggers a cut-off date in the visa bulletin. The Visa Bulletin reflects a backlog situation; it does not create that situation. If anything, an early Visa Bulletin cut-off date would be good news for visa timing overall, because it would mean that USCIS petition processing is proceeding more quickly than expected, and that 2025 set-aside visas may be maximized instead of lost.
Visa Bulletin retrogression will change the EB-5 market, because many people don’t believe in backlogs until reflected in the visa bulletin. I sadly keep getting marketing emails and seeing published articles with variations on this false/misinformed statement: “There is no significant retrogression concern for the time being for post- RIA investors who invest in rural and high unemployment projects (all of which remain current as of the latest State Department Visa Bulletin).” When the Visa Bulletin is silent, people don’t do the math with I-526/I-526 receipt numbers, and don’t calculate for themselves that all rural visas this year and all high unemployment visas this decade could be absorbed by the investors+family already in line as of mid-2024. When the Visa Bulletin speaks, then industry and prospective investors don’t need math or FOIA data to see oversubscription. For the sake of EB-5 program integrity, I’m glad that the Visa Bulletin is starting to give warning of a backlog situation that should already be informing industry and investor decisions. It’s highly material for issuers and investors to know whether the incentive supporting the investment exists or not.
Does it matter that the warning in the January 2025 Visa Bulletin might not be fulfilled, and that set-aside cut-off dates may not actually appear in 2025? For historical reference, the December 2012 Visa Bulletin first warned that “It appears likely that a cut-off date will need to be established for the China Employment Fifth preference category at some point during second half of fiscal year 2013.” But as it happened, China EB-5 did not get its first cut-off date until the May 2015 Visa Bulletin — thanks again to slow/low-volume I-526 and consular processing. Did past Chinese EB-5 investors with priority dates between 2013 and 2015 benefit from the delay in imposing cut-off dates? Not really, because excess demand was a fact regardless of when reflected in the visa bulletin. A delay in processing the China EB-5 crowd just resulted in lost EB-5 visas in 2013 and 2014. Subsequent visa bulletins show that China-born EB-5 applicants with April 2015 priority dates did not start getting visas until 2017 or finish getting visas until 2022, no matter the word “Current” in the April 2015 Visa Bulletin. On the other hand, a delay in imposing cut-off dates was great for the EB-5 market, which stayed hot under the attractively “current” visa bulletin and was able to raise over $14.3 billion dollars from China-born investors from FY2013 to FY2015. The harvest would likely have been much smaller, had Chinese investors realized at the time that everyone with priority dates from May 2013 would end up experiencing retrogression delay.
As discussed above, a Final Action Date in the Visa Bulletin does not suddenly make wait times longer than they were already. So it’s not quite honest to say “hurry to secure your place in line by filing I-526E before the Visa Bulletin imposes Final Action Dates.” Two Indian high unemployment investors, one with April 31, 2025 priority date and one with a May 1, 2025 priority date, would have nearly the same place in line and thus nearly the same visa wait time outlook regardless of whether May 2025 happened to be the month when the Visa Bulletin showed retrogression. No matter the visa bulletin status on the date of filing, these two investors will wait for as long as it takes to grant green cards to other Indian HU applicants with earlier priority dates, and to rest-of-world HU applicants with earlier and later priority dates.
However, there is some sense in a message “hurry to file I-526E before the Visa Bulletin imposes a Date for Filing for your country/category” — at least for investors based in the United States. While Chart B Date for Filing does not change the time to get a visa, it does change the opportunity for concurrent filing. A Date for Filing stops new investors from filing I-485 with I-526E, meaning they can’t immediately file for employment and travel benefits. And these interim benefits are valuable. I’ve had direct EB-5 clients who made recent EB-5 investments for the sake of EAD and advance parole, even understanding the likelihood of severe green card delay. Our hypothetical friends with the April 31 and May 1 priority dates may have the same green card waits but very different experience during the wait, if hypothetical Visa Bulletin retrogression in May 2025 meant that one could get I-485 on file and thus able to apply for and enjoy interim employment and travel benefits, while the other couldn’t.
For additional analysis, see Lee Li’s new article for IIUSA January 2025 Visa Bulletin: EB-5 Dates Remain Unchanged, Noting Possibility of Cut-Off Dates for Reserved Categories. and IIUSA’s newly-refreshed EB-5 Visa Data Dashboard. I have been working on detailed analysis that I haven’t yet published, but note that I continue to make timely updates to my Key EB5 Backlog Data file (always linked to the top of the EB5 Timing and Processing Data pages so the public can access as much data input as I have at any given time). Recently I am particularly benefiting from AIIA’s FOIA requests for Pre-RIA I-526 inventory data and Post-RIA I-526 and I-526E receipt data, because these datasets provide a breakdown by month that can be used in forecasting visa bulletin cut-off dates. Combining the recent wealth of FOIA data with newly-available granular NVC and I-485 numbers, I’m considering reopening my customized EB-5 timing service in the new year.
A reminder to all regional centers that the Integrity Fund payment for the coming year is due THIS WEEK by October 30, 2024 (i.e. 30 days from Oct 1). See https://www.uscis.gov/IntegrityFund, and discuss with your attorney to make sure of getting all the fiddly details right with the payment process. Any regional centers who miss this week’s deadline may have a chance to pay with a late fee penalty until December 30. Regional centers who do not pay in full by December 30, 2024 face termination. Many people were understandably confused by the process last year, and recently USCIS agreed (following litigation and advocacy) to offer a make-up opportunity for RCs that received termination notices over FY23 or FY24 fees. USCIS added a note to the EB-5 What’s New page this month that “For regional centers that failed to pay fees for FY 2023 and/or FY 2024, we are also accepting delinquent payments for FY 2023 and FY 2024 from Oct. 1, 2024, through Dec. 30, 2024.” However, the page warns that “We will reject any EB-5 Integrity Fund fee payments for FY 2023, FY 2024, and FY 2025 we receive after Dec. 30, 2024” and “we will take steps to terminate any regional center that, on or before Dec. 30, 2024, has not paid the required EB-5 Integrity Fund fees for each of FY 2023, FY 2024, and FY 2025.” If you’d like additional explanation, Carolyn Lee has recorded a webinar on Regional Centers: USCIS Integrity Fee Update – Compliance, Litigation, and I-956G Filing.
Resources
I’m happy to report that The Essential EB-5 Investor’s Guide is now published and available for purchase on Amazon. Many people know author Dilip Parameswaran from Telegram, where he has engaged with the EB-5 community and shared his experience as an EB-5 investor and professional financial analyst. I had opportunity to review and contribute to the book, and I salute Dilip for achieving a tough goal: lucidity. The book is introductory, addressing basic questions simply and concisely. At the same time it’s remarkably comprehensive, providing sophisticated treatment of both the investment and immigration sides of EB-5. Dilip has turned his own hard-won EB-5 education into an efficient, systematic, and unbiased curriculum to help others. The book is by and for EB-5 investors, but I would recommend it to new EB-5 issuers and project companies. Blogs like mine can become a confusing blizzard of shifting detail. This book lays out a solid basic framework for thinking about how EB-5 works.
I also contributed recently to a short, free guide prepared from an industry perspective and published by JTC: EB-5 Investor Due Diligence: Finding the Right Project for Immigration Success. This whitepaper addresses project structures and timelines, and suggests practical considerations and questions for vetting EB-5 offerings.
Meanwhile, I continue my day job of writing business plans for immigration purposes. Thank you to everyone who voted for me as a business plan writer in the EB5 Investors Magazine Top 25 poll — this year and since 2016.
EB-5 Retrogression Update
As I wrote in August for the EB-5 visa availability FAQ, retrogression happens IF a large crowd of potential applicants forms, with enough people to exceed annual visa availability, and WHEN that large crowd reaches the stage of becoming qualified visa applicants. October has provided new info on both the “if” and “when” questions.
“If”: I-526E filing numbers continue to show that retrogression is a foregone conclusion in the High Unemployment category, at least for China and India, and closing in on a possibility for the Rural category. IIUSA shares its most recent FOIA data in Post-RIA EB-5 I-526E Data Trends: Insights and Implications for Investors and Stakeholders (October 21, 2024) and Potential Retrogression and Visa Waitlist in the EB-5 Program (October 28, 2024). IIUSA analyzes pipeline demand for EB-5 reserved visas, and points to potential advocacy remedies for demand/supply imbalance. I salute IIUSA for taking the key first step toward recovery – acknowledging that we have a problem – and for starting to foresee advocacy steps toward EB-5 visa relief. AIIA is also vigilant on this issue, and I look forward to their FOIA results coming soon. I’ve been writing up a detailed analysis that puts post-RIA petition filing numbers and other recent data in a wider context of overall EB-5 visa availability in the coming five years, considers scope for matching visas to applicants across per-country and TEA-category limits, and notes variable assumptions about visa demand per investment. My analysis takes ten tough pages to reach the same basic conclusion as other analysis: EB-5 needs more visa numbers to remain viable.
“When”: Even as I-526 and I-526E numbers show a growing pipeline backlog, data from Department of State continues to moderate our expectations for how quickly that backlog could reach the point of claiming all available annual visas and thus triggering Visa Bulletin retrogression. In May 2024 DOS had reported nearly 1,000 post-RIA applicants already registered at the National Visa Center, but also noted that EB-5 applicants were taking 4-9 months from NVC notification to interview scheduling. As it turned out, Department of State did not manage to schedule any interviews for reserved visas until August 2024 – and then only four High Unemployment visas (“RH”) were issued in Vietnam. (See Monthly IV Issuances and p. 14 of minutes from the October 2024 AILA DOS Liaison Committee Meeting. On the status adjustment side, DOS reported that only 17 reserved visas had been issued through AOS by May 2024.)
The timing of Visa Bulletin retrogression has been pushed back by visa-stage delays on top of a sluggish process at USCIS. IIUSA’s FOIA request indicated that as of early July 2024, only 478 Rural I-526E and 240 High Unemployment I-526E had been approved – not near the number needed to generate qualified applicants for all the 4,200+ rural visas and 2,100+ high unemployment visas available in FY2025. I expect I-526E approval volumes to increase dramatically going forward, as USCIS likely moves adjudication capacity from the disappearing pre-RIA backlog onto the thousands of pending post-RIA I-526E. But I-526E processing speed now may come too late to maximize FY2025 reserved visas, considering the slow process remaining following I-526E approval. I currently do not expect the Visa Bulletin to move for EB-5 set-aside categories in FY2025. This could be good and bad for EB-5.
Slow-walking the EB-5 set-aside backlog creates a mix of opportunity and confusion. So long as the Visa Bulletin does not announce cut-off dates for EB-5 set-aside categories, new EB-5 investors in the U.S. can continue to enjoy the window to concurrently file I-485 with I-526E, regardless of where they were born, and thus secure valuable travel and employment benefits that will remain potent even through any future EB-5 retrogression. However, people may be confused into thinking that they’re not entering a serious backlog situation with respect to green cards, just because not yet flagged yet in the visa bulletin.
Meanwhile, October brought good news for the over 30,000 retrogressed applicants in the EB-5 Unreserved category. FY2025 will likely have over 11,000 Unreserved visas available to distribute, thanks to including unused reserved visas carried over from FY2023. While Department of State has not yet announced the annual limits for FY2025, USCIS recently updated the AOS FAQ page to say: “The employment-based (EB) annual limit for fiscal year (FY) 2025 will be higher than was typical before the pandemic, though lower than in FY 2021-2024. We are dedicated to using as many available employment-based visas as possible in FY 2025, which ends on Sept. 30, 2025.”
And now another important data drop, as USCIS has added all EB-5 Set-Aside categories for the first time to the report of pending employment-based I-485 published monthly at the USCIS Immigration and Citizenship Data page.
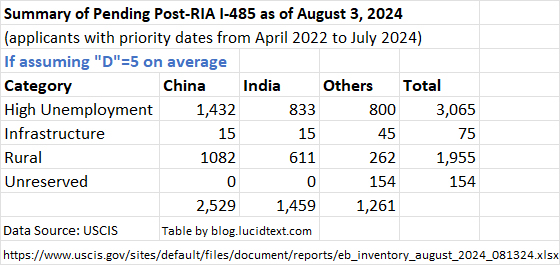
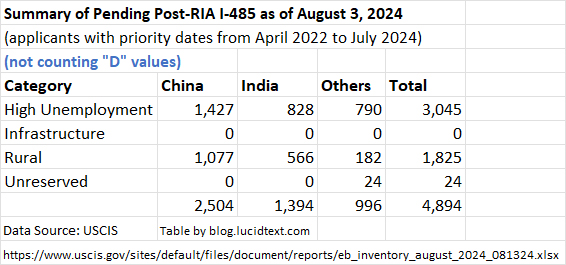
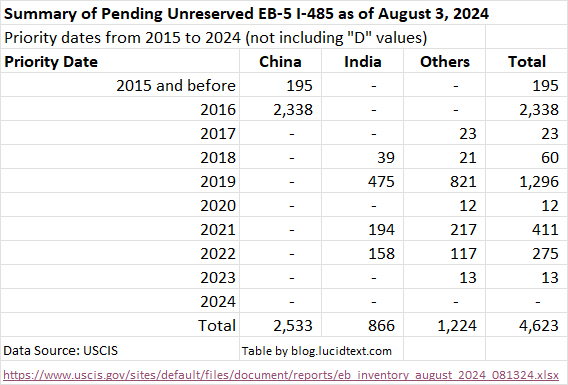
Pending Applications for Employment-Based Preference Categories as of August 3, 2024 (XLSX, 109.41 KB) is wonderfully timely, providing comprehensive I-485 inventory data just a few weeks old. The report now lists pending EB-5 I-485 inventory itemized according to visa category (Unreserved, High Unemployment, Rural, Infrastructure), petitioner priority date (month year), and petitioner country of chargeability (China, India, Mexico, Philippines, or Rest of World). I-485 can now be filed concurrently with I-526/I-526E, so this report is effectively another view into I-526/I-526E receipts by country and TEA category. It’s limited to the portion of investors who are in the USA pursuing status adjustment, not including demand from abroad, but has the advantage of being very recent, and updated monthly.
The August I-485 report reflects late-breaking EB-5 TEA demand trends, and shows continued strong demand for rural TEA investments. (9/20 UPDATE: The chart originally posted here showed a more dramatic trend that resulted not from reality, but from the fact that I made an error in copying and pasting from one spreadsheet to another. Thanks to a vigilant reader who checked my work and found the error!)
The August I-485 report surprised me by recording some petitions in the Infrastructure category. The exact numbers are small, redacted with a “D” (meaning <11) in every month they appear. But still interesting, as I had thought that the Infrastructure category wasn’t being used at all. It’s also interesting to compare the reported I-485 inventory (which includes principals plus family) with our latest data for I-526/I-526E filings through early 2024.
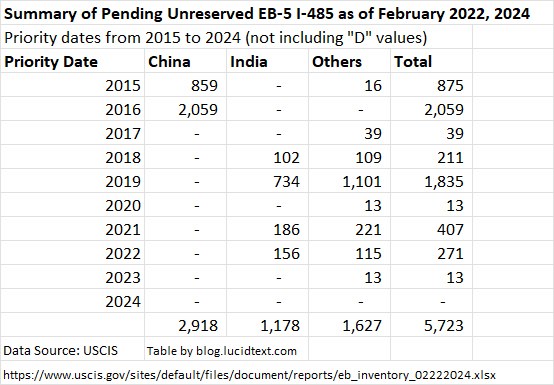
The August I-485 report includes data for EB-5 Unreserved, which is interesting to compare with past reports, to get a sense of who exited the inventory by getting visas over time. (While keeping in mind that the pending inventory is not only reduced by visa issuance, but also expanded as new applicants file I-485.)
I’ve been tracking the monthly I-485 reports since February 2024 (when this report format was first introduced), and have seen USCIS struggle with how to report the EB-5 numbers. The February report only recorded EB-5 priority dates through 2022, the April report had 2023 and 2024 priority dates but only for ROW and all categorized as Unreserved, the May-to-July reports added a lump row for Set-Asides, and August finally figured things out and has data individually recorded for each TEA category and country. The monthly I-485 pending inventory is a very valuable report, and I look forward to tracking ongoing updates.
As I prepared Monday’s post on the Visa Bulletin, I looked at the number 9,158. This number represents 9,158 Chinese investors plus family who contributed at least $500,000 per family in 2014/2015 for the chance to qualify for an EB-5 visa. The Visa Bulletin showed “C” – no restriction – for China EB-5 through 2014 into the first half of 2015 (only beginning to establish cut-off dates in May 2015, and even then only implying a two-year wait with a 2013 date). How many of those people realized that they’d still be here a decade later, visa-less, a statistic on the 2024 NVC waiting list? Visa availability problems were predictable in retrospect, considering the 25,000 I-526 filed in 2014/2015, but we didn’t talk much about pipeline visa demand in those days. In honor of everyone taken sadly by surprise, and hoping not to repeat that history, we are more careful now to track and report not only the visa-stage demand reported in the visa bulletin, but also on pipeline demand coming up from I-526/I-526E filings.
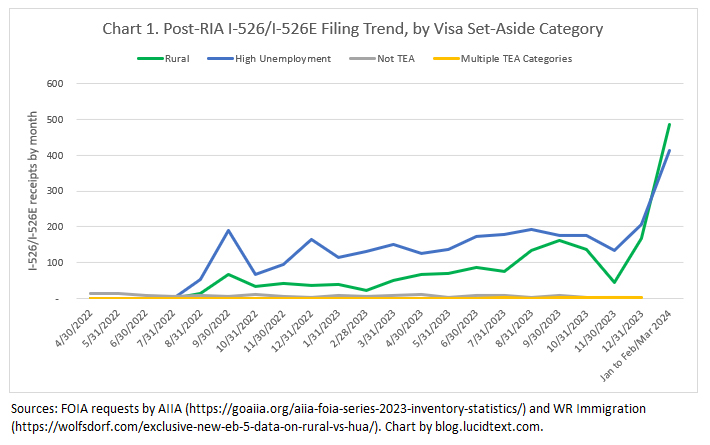
I’m happy to report another important addition to the treasury of I-526/I-526E receipt data, with detail on visa category and petitioner county as needed for visa pipeline analysis. This dataset is courtesy of the efficient Joey Barnett of WR Immigration, who managed to extract a record-quick Freedom of Information Act response from USCIS, and immediately and generously made the full record available to the public. The data is published in a blog post here: “Exclusive New EB-5 Filing Data on Rural v. High Unemployment Area Demand as of April 2024!” You’re invited to join Joey Barnett and Charlie Oppenheim in discussing the data during the next edition of The Bulletin – Chatting with Charlie: EB-5 Investor Outlook on September 26, 2024.
Prior to the WR Immigration FOIA request, the most recent publicly-available TEA-and-country-specific data was from AIIA FOIA Series: Updated I-526E Inventory Statistics for 2023. The AIIA FOIA data was monthly through the end of 2023, and highlighted a handful of high-demand countries. The WR Immigration FOIA data is annual, but extends through the first part of 2024 and lists results for every single petitioner country.
The comprehensive county-specific detail in the WR Immigration FOIA provides interesting material for the question “where are regional centers finding EB-5 investors these days?” I see that AIIA already has a post up from this angle.
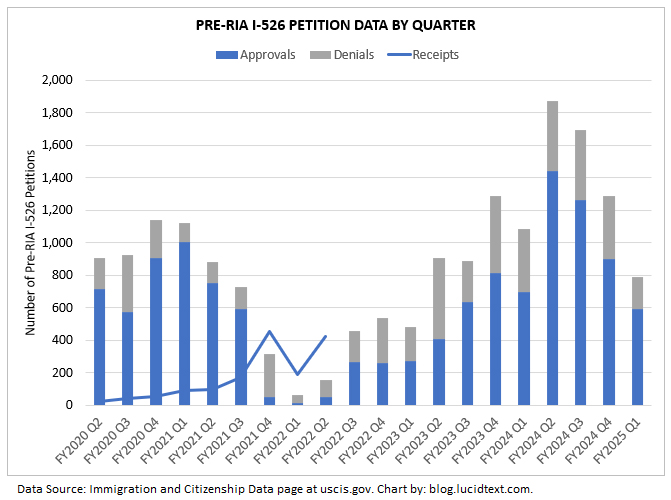
For backlog analysis, the WR Immigration FOIA is critical because it covers at least part of the great filing surge of Q2 2024, when 1,879 I-526 and I-526E were filed. We’ve needed to know where those 1,879 people came from, and where they invested, to help get a handle on potential TEA and country-specific backlogs. And now we have more information about it.
It’s tricky to date FOIA responses, because USCIS only reports the date that they queried the database, leaving us to guess how up-to-date the database was at that point. The WR Immigration FOIA is dated as of April 18, 2024. Comparing the FOIA totals with the totals that USCIS ended up officially reporting, we can conclude that the WR Immigration FOIA report captures cases filed through about February/mid-March 2024.
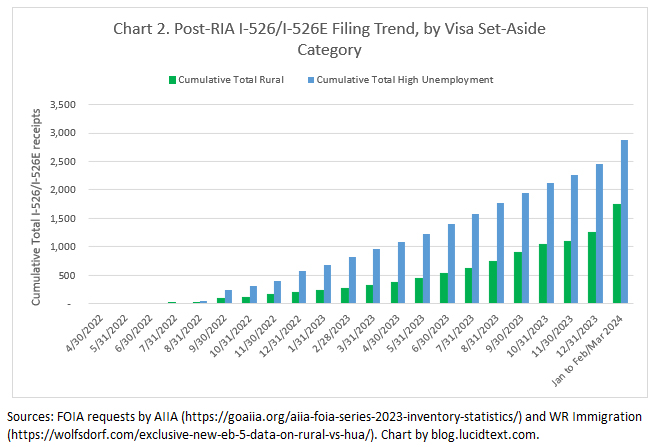
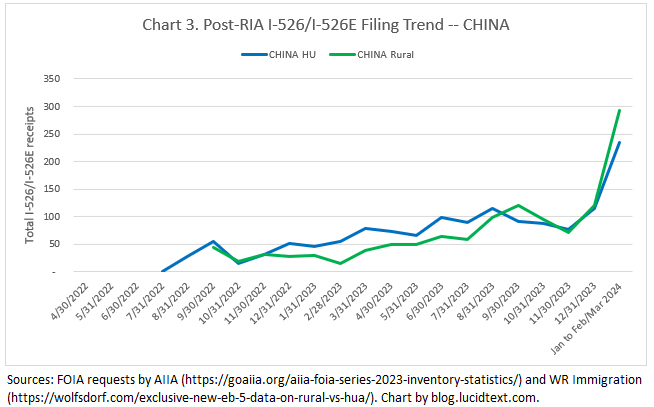
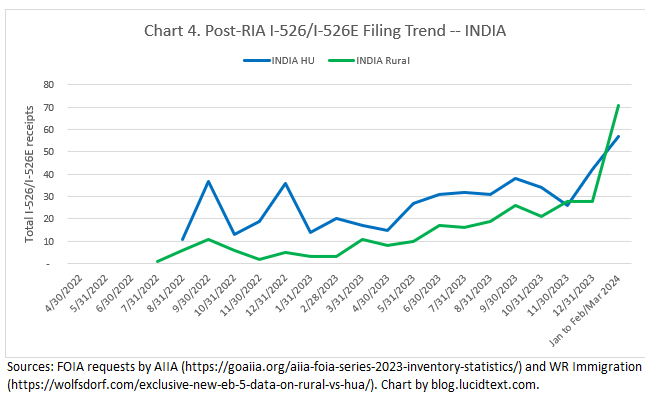
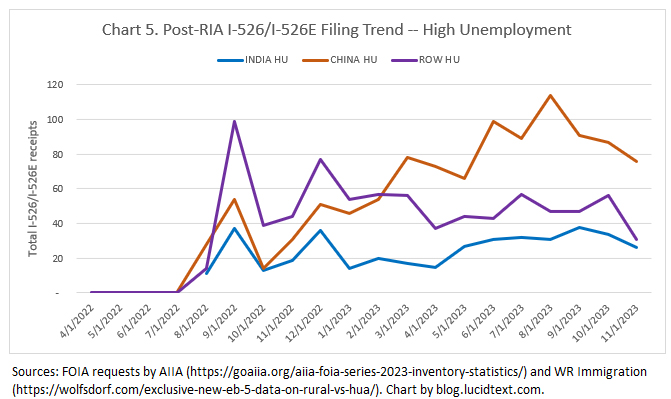
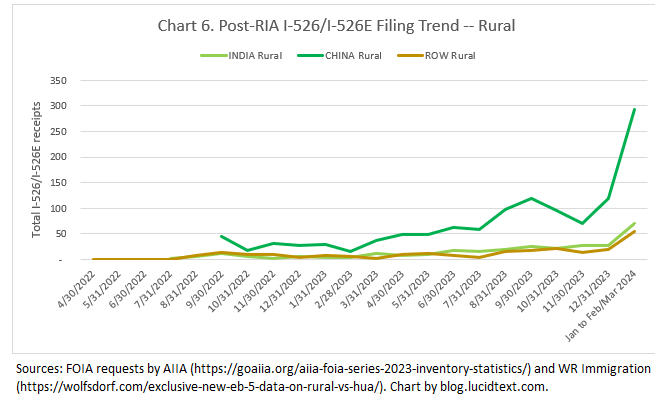
I’ll let charts tell the story of what happened during the recorded part of the March 2024 filing surge, including how Rural demand surged ahead for the first time (particularly thanks to China), while High Unemployment demand dipped but remained sufficiently strong to continue to dominate the cumulative inventory. (The charts combine AIIA’s FOIA data for 2022-2023 with WR Immigration’s FOIA for 2024.)
And finally, here’s the table that highlights my concern in the data: what’s going to happen to these data points when they’re people with families approaching the visa window?
For a rough estimate of future visa demand from the I-526 pipeline, I conservatively multiply the I-526 receipts by 2. This underestimates typical family sizes, but considers the possibility of denials and other attrition. And then I look at estimated cumulative visa demand and future visa supply and think about the balance.
FY2025 is carryover year, with extra visas available. What would happen in the best-processing case/worst-visa-case scenario that the entire pipeline of investors filing I-526 up to March 2024 reached the visa stage in FY2025? Looking at the numbers, I see that they would find enough rural but not enough high unemployment visas to accommodate them. In that case, FY2025 would end with Visa Bulletin cut-off dates for high unemployment, and a backlog going into FY2026 without the promise of carryover from unused HU visas. In real life, slow I-526E processing looks likely to continue to slow-walk the backlog (as it has been slow-walked to date) such that FY2025 doesn’t get sufficient applicants to max out FY2025 visas. In that case, the visa bulletin would not move yet in FY2025, and FY2026 would also have extra visas. In that case, the pipeline that had built by early 2024 would be getting visas in 2026 and years beyond.
If I were an investor from China or India, I would look not only at the China or India pipeline, but also at ROW (meaning applicants from the “rest of world”). ROW is important, because the number of annual visas available to me, as an applicant subject to country cap, is equal to 7% PLUS a share of any visas not absorbed by ROW. Every one ROW visa issued is one fewer visa that might be available to my country over the country cap. The ROW pipeline is also a target for people wondering if it’s possible to diffuse demand pressure from TEA set-aside categories. (But notice that High Unemployment shows enough demand from China and India alone to absorb 2+ years of visas even if they were the only applicants, even if 100% of the documented ROW HU pipeline left the HU category and chose to receive Unreserved visas instead.)
Still have questions about what the numbers mean? Note that the FAQ I just finished addresses topics such as which countries are affected by country cap limits and retrogression, how applicants may choose a TEA or Unreserved category, and how annual EB-5 visa availability gets calculated.
October begins a new fiscal year, with a new stock of visas available to EB-5 applicants. The October 2024 Visa Bulletin includes significant movement for EB-5 dates for China and India. To understand this movement, it’s necessary to look at the dates in context of what they represent – visa applicants with priority dates.
Does a final action date of July 15, 2016 for China mean that most Chinese EB-5 applicants with priority dates earlier than July 2016 can expect visas shortly? Does a final action date of January 1, 2022 for India mean that most India-born EB-5 investors with priority dates in 2021 and earlier can expect visas shortly? Looking at the number of applicants in progress compared with FY2025 visa availability, the answer is “maybe” for China, and “no, certainly not” for India.
First, consider the supply of Unreserved visas available to allocate this year. The precise numerical limit has yet to be announced (it will eventually appear here), but FY2025 will have at least the base allocation of 140,000*0.071*0.68=6,759 new-issue Unreserved EB-5 visas, plus an additional 4,000+ visas thanks to carryover from a portion of Reserved visas not used in FY2024. (That is, unless the IIUSA lawsuit succeeds in challenging the carryover law. See slide 18 here for additional analysis.) So, we’re potentially looking at around 11,000 Unreserved visas available in FY2025, of which India can expect about 7% (770), and China with its old priority dates can expect 7% plus what’s leftover after India and as many ROW visas as consulates can manage to issue. I guess that at least 4,000 to 5,000 Unreserved visas will end up being available to China in the coming year.
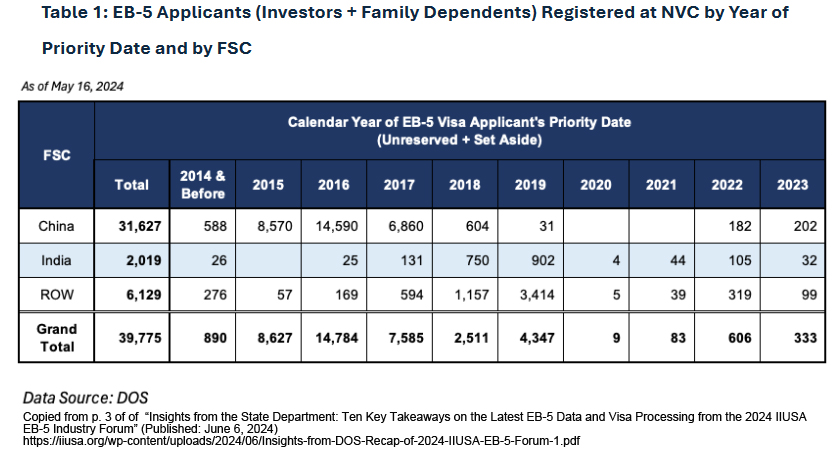
And now let’s consider the Unreserved applicants lined up for FY2025 visas. Potential applicants can be in multiple places – still with I-526 pending, with I-526 approval but waiting for NVC transfer, with pending I-485, and/or registered at the National Visa Center for consular processing. But let’s just look in one place – at applicants registered at NVC as of May 2024, according to a chart provided by Department of State and included on p. 3 of “Insights from the State Department: Ten Key Takeaways on the Latest EB-5 Data and Visa Processing from the 2024 IIUSA EB-5 Industry Forum” (Published: June 6, 2024).
The following sections consider what this table means for India Unreserved, China Unreserved, and 5th Set Aside in the Visa Bulletin.
India — EB-5 Visa Applicants vs Visa Bulletin Dates
Table 1 above has a stark message for India: 1,834 applicants with 2019 and earlier priority dates were still waiting at NVC for Unreserved EB-5 visas as of May 2024 – and that’s only at NVC, not counting 1,000+ Indians waiting for I-485 status adjustment as of April 2024, or potential applicants waiting for I-526 approval and NVC transfer. (Note: there is potentially significant overlap between the I-485 list and both the NVC list and the pending I-526 list.)
The crowd of Indian applicants reported by DOS in May certainly did not just disappear between May 2024 and today. Some registered applicants may have given up or switched categories by this time, but it’s improbable that they suddenly all got tired of waiting and gave up en masse. 2018 and 2019 priority dates are not that old, and a number only became qualified recently given I-526 approval timing. 1,800+ Indian applicants could not have received visas in the last months of FY2024. (As of May, DOS reported having already issued 864 of the approximately 995 visas available to India in FY2024 under the country cap.) Therefore, it’s likely that at least 1,700 India-born applicants with 2019 and earlier priority dates are still waiting today. With likely fewer than 800 Unreserved visas available to India in FY2024, Department of State can’t realistically get even close to allocating visas even all qualified Indian applicants NVC with 2019 and earlier priority dates this year, much less be able to move on to 2020 and 2021.
I can’t guess what the October 2024 visa bulletin DOES mean for India. What could it mean, except that DOS made a typo, or for some reason anticipates issuing a few lucky visas out of priority date order? The typical reason for moving Visa Bulletin dates — to “stimulate demand” i.e. push USCIS to adjudicate more petitions or potential applicants to submit documents — wouldn’t make sense here since NVC reports already having plenty of applicants. What we can see, from pending applicant data, is that the October 2024 Visa Bulletin cannot possibly mean a message that the pre-December 2020 India backlog is clear, or that the majority of 2020 and 2021 India priority dates can expect EB-5 visas soon.
EB-5 visa issuance to India has been confused by the fact of non-FIFO I-526 processing. Some Indians with 2019 priority dates have visas already, while others are still stuck waiting for I-526 approvals or transfer to NVC. The India backlog is also complicated by surges – for example of all I-526 filed by Indians in 2019, 50% were filed in the single month of November 2019. No wonder Department of State struggles to maintain queue discipline for India EB-5. For Indian applicants trying to think through the “where am I in the queue” question, I recommend a dataset recently shared with me by a blog reader, and copied starting in Row 467 of the Pre-RIA Demand tab in the Excel sheet I keep linked to the top of the EB-5 Timing page. My reader used FOIA to request an accounting of pending and approved status for I-526 filed by Indians between January 1, 2017 and April 1, 2022. Looking at this report, you can see the pattern of demand over those months, and see also how I-526 processing – approving a few in each month while leaving others behind – can have resulted in date confusion at the visa stage.
China — EB-5 Visa Applicants vs Visa Bulletin Dates
Table 1 above shows that the National Visa Center still has a significant number of China-born applicants with 2015 priority dates, and sufficient applicants with 2016 dates to absorb years-worth of visas. Demand in 2015 and 2016 came in surges, so I took an extra step to divide the China inventory by quarter. The following table shows a quarterly estimate created by taking the proportions for worldwide I-526 receipts reported by quarter in 2015 and 2016, and applying those proportions to data by fiscal or calendar year for China I-526 receipts and China NVC inventory. I included I-526 receipt numbers, as background for the number of Chinese who started the process. (Based on I-526 inventory status and recent denial rates, I will guess that most Chinese applicants with 2015 and 2016 priority dates who are ever going to reach the visa stage are registered at NVC and/or on pending I-485 by now.) The table includes information on pending I-485, which USCIS reports by month of priority date.
Priority Date
Total I-526 Receipts from China-born investors
China-born applicants registered at NVC as of May 2024
Pending I-485 for China-born applicants as of April 2024
Before 2015
588
85
2015 Q2 Jan – Mar 2015
1,570
1,167
23
2015 Q3 April – June 2015
1,682
1,250
36
2015 Q4 Jul – Sep 2015
4,471
3,323
162
2016 Q1 Oct – Dec 2015
3,808
2,830
319
2016 Q2 Jan – Mar 2016
391
546
103
2016 Q3 April – June 2016
1,415
1,976
332
2016 Q4 Jul – Sep 2016
5,334
7,447
1,165
2017 Q1 Oct – Dec 2016
3,310
4,621
778
Total with priority dates prior to January 2016
9,158
625
Total with priority dates prior to June 2016
11,680
1,060
Total with priority dates prior to January 2017
23,748
3,003
Looking at the distribution by quarter, I notice the surge of demand from July to December 2015, followed by smaller crowd from January to June 2016, followed by another big surge in July to September 2016 (the last big peak, as we now know). No wonder the Visa Bulletin spent years in late 2015, but now foresees a leap through the first half of 2016, and then slow again through the second half of 2016.
Looking at the large number of total applicants as of mid-2024 with priority dates prior to January 2017, I can see why Department of State had no need to advance Chart B Dates for Filing to encourage even more applicant filings in those dates. It makes sense that the October 2024 Visa Bulletin retrogressed Chart B to prevent even more additions to that already-large crowd.
I see that as of May 2024, there were around 12,000 China-born applicants ready to go with priority dates before July 2016. Could Department of State think it’s possible to get anywhere near applicant #12,000 by the end of the coming fiscal year? It’s just conceivable they might get close, considering that China-born applicants may have gotten another 3,000+ visas June-September 2024, that China-born applicants could have access to 5,000 or so visas in FY2025, and that high-volume drop-out rates and denials among old 2015 priority dates are plausible. On the other hand, if all those applicants recorded at the National Visa Center and on pending I-485 in mid-2024 do indeed represent active applications from people still able and willing to claim visas, then it will take several years to issue visas to everyone with pre-July 2016 priority dates. In that case, neither Chart A nor Chart B would need to move again for China any time soon.
The major “what if” factor for China Unreserved at this point is the volume and pace of demand for Unreserved visas from the Rest of the World, since this directly constrains the supply of visas every year to China. For more data, see the Pre-RIA Demand tab in the Key EB-5 Backlog Data file, which I keep linked to the top of my EB-5 Timing page and update regularly. And keep an eye on the discussion about whether post-RIA Rest of the World applicants should be encouraged to select Unreserved visas rather than the set aside visas for which they also qualify.
Post-RIA EB-5 Visa Applicants vs Visa Bulletin Dates
The October 2024 Visa Bulletin still has “C” across the board in the 5th Set Aside categories, meaning no priority date restriction yet on who can get final action or file I-485. Again, this is a function of the number of applicants ready to go at the visa stage. Scroll back up to Table 1 at the top of this post, and see that <1,000 applicants were registered at NVC with 2022 or later priority dates as of May 2024. That’s not sufficient applicants to get anywhere near absorbing the 4,000+ rural visas and 2,000+ high unemployment visas that were available in FY2024 and will be available in FY2025, even if all were rural or high unemployment applicants. And the inventory of qualified post-RIA visa applicants likely isn’t much greater now, considering the low volume of I-526E approvals since May. When will the Visa Bulletin change for 5th Set Aside categories? The answer depends on USCIS, and when USCIS can manage to advance more applicants to the visa stage by approving more I-526E.
FY2024 Q3 data shows minimal movement for post-RIA I-526/I-526E petitions, and continuing high processing volume and backlog reduction for pre-RIA I-526 and I-829. Receipts fell in Q3, especially for I-526E, but not as much as I expected after the April 1 USCIS form fee increase.
USCIS has worked aggressively in 2024 to clear the inventory of pending pre-RIA forms. By June, USCIS was down to a net backlog of only 100 I-526 petitions, and had reduced the I-829 net backlog to 5,000. (“Net Backlog is Gross Backlog minus any customer induced delays (i.e. RFE, intent to deny, etc.) and visa unavailable cases.”) It is likely that as of today, USCIS has already at least assigned nearly every pre-RIA I-526, except for I-526 from Chinese investors who don’t have visas available. If recent volumes continue, every I-526 and I-829 pending today will have been processed before June 2025. Kudos to IPO staff and Chief Alissa Emmel for making this happen! Meanwhile FY2025 visa bulletins will be interesting, as Department of State works to match FY25 visas to the influx of new Unreserved applicants from I-526 approvals.
Processing activity for post-RIA investor petitions picked up slightly in Q3, but is still extremely low in context of the I-526E backlog and the number of reserved visas waiting for applicants. Two factors give me hope for a major boost to I-526E processing numbers coming soon: the uptick in I-956F processing in Q3 (with I-956F approval being precursor to I-526E approval), and the fact that the disappearance of the I-526 backlog is about to free up major adjudicator capacity that might be moved to I-526E processing. USCIS processed nearly 6,000 I-526 in the past 12 months, and such productivity would quickly decimate the I-526E backlog. I’m optimistic that USCIS/Department of State will at least be able to issue all Reserved visas available in FY2026, considering the processing potential. However, low processing volumes to date may mean that some FY2025 Reserved visas will go unissued for lack of qualified applicants advanced in time.
And a few other points of interest. Both I-526 and I-829 denial rates were down in Q3, to 25% and 5% respectively. A handful of I-526E denials were reported for the first time in Q3 — and I expect to see more soon, considering that USCIS denied 25 I-956F project applications so far this year. The number of I-956 regional center application filings hardly dropped in Q3, despite the massive filing fee increase. And apparently USCIS approved one I-924 in Q3. Mysterious!
I’ve copied below charts to highlight salient features and trends, as well as updating my Processing Data page and Key EB5 Backlog Data excel file. And heads-up for additional data and analysis coming in the next few weeks.
USCIS still does not report I-526E processing times, but IIUSA has stepped into the gap and worked with regional centers to collect and analyze a large database of anecdotal evidence for actual I-526E and I-956F processing times. I’ve been assisting Lee Li with this important project, and look forward to the results to be released shortly. You’re invited to join us for a webinar on October 2, 2024 on “New Data and Emerging Trends: I-526/I-526E Filings, Adjudications, and Processing Times”
AIIA continues the critical effort to extract information from USCIS on the breakdown of post-RIA I-526 and I-526E filings by TEA category and applicant country of birth, to help keep a pulse on potential visa backlogs. They hope for a response next month to the FOIA request covering the filing surge in January to March 2024. (Currently, we only have data through December 2023.)
I’ve been working on a major project to research and write FAQ covering questions about EB-5 visa availability and allocation. The 26 short articles that comprise this project will be published next week – look for an announcement and links here next week Tuesday.
On the visa front, Department of State announced that it succeeded in issuing all EB-5 Unreserved visas available for FY2024 – good news for pre-RIA investors, and particularly for long-suffering Chinese investors who were able to pick up a large number of FY24 visas thanks to the productive consulate in Guangzhou. I will write separately about the visa outlook for FY2025 (which is unfortunately currently subject to litigation, as discussed by IIUSA and AIIA).
Today USCIS published form receipt and processing data for FY2024 Q2 (January to March 2024) on the USCIS Immigration and Citizenship Data page. I’ve updated my Processing Data page with all the FY24 Q2 EB-5 numbers, and provide charts in this post to highlight the big news.
New EB-5 filings skyrocketed in January to March 2024. Meanwhile, IPO took a large bite out of the EB-5 backlog with impressive productivity that recalls the good old days of 2018. We’re setting up for a busy and crowded time at the EB-5 visa windows in 2025 and beyond. (In other news, I’ve also updated my data repository with key visa-stage EB-5 numbers shared by Department of State at the IIUSA conference last month, to be discussed further in forthcoming articles. See IIUSA’s conference slides and a nice follow-up analysis by Lee Li that gives further detail and clarification.)
Post-RIA I-526 and I-526E Receipt Trend
USCIS reports that a whopping 1,810 I-526E and 69 I-526 were filed last quarter.
Counting up the quarterly reports from April 2022 (following the passage of RIA) to March 2024, we can see that USCIS has reported a cumulative total 5,344 post-RIA I-526 and I-526E filed, and 429 processed. (As a side note, the cumulative count conflicts with the FY24 Q2 period-end pending count. In the past, I’ve noted that the pending number ends up skewed after filing surges – I guess because last-minute end-of period receipts get counted as receipts in the period but only added to pending in the next period.)
In context, since RIA passed two years ago, EB-5 investors have brought at least 5,344*$800,000=$4.275 billion dollars into the U.S. economy. This investment was incentivized by the hope that approximately 5,344/.35=15,000ish visas will be available to these investors plus their spouses and children. (35% is an historical average of principals in EB-5 visas issued.) The number of post-RIA applicants who actually make it to an EB-5 visa will likely be significantly smaller due to country-specific variation and attrition, but the size of the upfront hope is impressive and sobering. Congress has not set aside sufficient annual visa numbers for this level of willingness to invest in economic growth and job creation. We don’t yet know how all I-526E filings break down by country or TEA category (AIIA has another FOIA request in progress for numbers since since November 2023), but this is a lot of prospective EB-5 visa applicants to fit in any lane, including Unreserved given the pre-RIA backlog. EB-5 visa advocacy should already be an urgent priority.
IPO Processing Productivity
As I’ve been reporting based on unofficially obtained data, IPO has made a quantum leap in processing productivity. The first chart illustrates recent processing volume in historical context. The second chart compares FY24 Q4 processing productivity against the size of the backlog for select EB-5 forms. If IPO keeps processing at this rate, the pre-RIA I-526 and I-829 backlogs at USCIS will be gone within 12 months. And then adjudicators currently proving ability to turn out thousands of decisions per quarter will be able to shift focus and make quick work of the post-RIA inventory and incoming receipts. IPO still hasn’t published the RIA-required timely processing fee study, but even better it has gotten on track to actually realize the RIA timely processing goals in the foreseeable future.
I most recommend the I-829 questions 6-9 in the EB-5 General Questions and Answers document. This is fresh content, covering questions about how to add eligible derivatives to I-829, reasons for duplicate I-829 receipt notices, how project fraud affects I-829 eligibility, and steps following an I-829 denial. (I gained less from the other May 2024 Q&A, a number of which belatedly respond to outdated questions that IIUSA submitted back in 2020, including Q&A on the now-non-existent I-924A process.) The I-956 form overview Youtube videos are nicely presented, and will be especially useful for those who struggle to follow the form and instructions. I noted a bit of new content on I-956 supporting evidence and high employment area reporting on I-956F.
Intel on I-829 Adjudication and Source of Funds Denials
USCIS Q&A do not discuss the increasing rate of denials around EB-5 source of funds, but industry has managed to gain inside intel through Freedom of Information Act requests. Ed Ramos’ recent article quotes adjudicator training materials that support my suspicion of an anti-China bias in EB-5 adjudications. Links to related articles:
USCIS continues to regularly update the Employment-Based Adjustment of Status FAQs page, most recently with a response to this important question: “Q. What information is available regarding how many pending Forms I-485, Application to Register Permanent Residence or Adjust Status, USCIS currently has in its inventory in the employment-based categories by country of chargeability?” USCIS responded with a detailed report of the pending inventory for all EB categories, itemized by country and month/year of priority date. Here is the USCIS report: Form I-485, Application to Register Permanent Residence or Adjust Status – Pending Applications for Employment-Based Preference Categories. And here is a link to my Excel, with EB-5-specific data from the USCIS report extracted and formatted for analysis.
The report is extremely valuable, the first EB-5 I-485 inventory breakdown that USCIS has published since 2019. It is also a bit frustrating to interpret. I wonder why USCIS does not report pending I-485 for the EB-5 reserved categories, though we know that at least hundreds of such I-485 have been concurrently filed since 2022. The data is for Unreserved EB-5 only. USCIS redacts any number <11 with the letter “D,” which means that the EB-5 I-485 inventory total (where “D” appears in 150 fields) could be up to 1,500 higher than the number of forms individually reported. The USCIS report distinguishes between I-485 with and without visas available, but not between I-485 with and without approval of the underlying petition. I don’t know why the total reported EB-5 inventory in this report is so much higher than the number of EB forms reported pending at the California Service Center, which reportedly handles all EB-5 adjustments. All that said, the data is so interesting! We used to ignore pending I-485 when calculating pipeline demand for EB-5 visas, because the number of EB-5 investors using status adjustment vs consular processing used to be so small. But the current crowd of 5,723 to 7,223 people with pending I-485 for unreserved EB-5 is certainly worth counting.
Total pipeline of unreserved EB-5 visa applicants as of X date for a given country is = A + B + (the portion of C not represented in B, less denials, plus family), adjusted for estimated changes between “data as of” date and X date
EB-5 Unreserved Visa Pipeline Demand
In the above table, you can visualize each row as a queue leading up to a visa window, and each column as capturing a count of people at one stage in the queue. So for example, a Brazilian EB-5 applicant with a 2023 priority date can consult all data points in the “Rest of World” row in the above table to get a sense of the total number of applicants who will be in front of him (based on earlier priority date priority) if he decides to join the Rest of World Unreserved visa queue instead of going for a set-aside visa.
Department of State Q&A on set-aside visa allocation
Data for pipeline demand in the different EB-5 categories is very consequential today, because many post-RIA investors will face a category choice. Many I-526E approval notices give investors the option to join the EB-5 Unreserved queue instead of the Rural or High Unemployment queue for which they also qualify. DOS confirmed this in a Q&A published in minutes from Department of State/AILA Liaison Committee Meeting March 20, 2024.
Can DOS describe the process by which applicants with EB-5 immigrant visa petitions approved with dual Reserved and Unreserved status will be asked to notify the National Visa Center under which processing status they wish to proceed?
Response: Beginning March 21, 2024, IV applicants who USCIS has approved for more than one EB-5 visa classification, reserved or unreserved, will be contacted by NVC and required to select only one of the approved visa classes indicated on their I-797C approval notice and submit their choice using NVC’s online public inquiry form. EB-5 visa applicants will not be scheduled for an interview until they have made a selection. NVC will not select an EB-5 visa class for an applicant. Applicants will be contacted to identify their choice at the Welcome Letter stage. Applicants who have an approved petition and do not receive a notice from NVC should contact us via the online public inquiry form.
How can EB-5 applicants make the best choice? One wants to choose the category with the least severe demand/supply imbalance. I’ll be writing about this in another post, but in the meantime encourage contemplating the data in the EB-5 Unreserved Pipeline Demand table above, and AIIA’s FOIA data for reserved categories.
Last week IIUSA sued USCIS over Q&A that interpret the two-year minimum investment sustainment period, disputing that the EB5 Reform and Integrity Act of 2022 (“RIA”) actually changed the EB-5 sustainment requirement. Concurrently, IIUSA petitioned USCIS for rulemaking to write a minimum five-year investment holding period into the EB-5 regulations. This move is potentially extremely consequential for the program and for investors, and also problematic. My comment brings a perspective from EB-5 process timing.
The IIUSA litigation complaint explains why regional centers would seek government support for holding on to EB-5 funds for a minimum of five years:
97. As explained above, USCIS has long required investors to sustain their investment “over the two years of conditional residence.” 8 C.F.R. § 216.6(c)(1)(iii). This longstanding rule has incentivized regional centers to invest in high-quality projects that are more likely to generate return for investors, create the necessary number of jobs, and deliver benefits to the community at large. The practical reality is that these large-scale projects require longer investment periods, and as such the industry standard investment term for regional center-backed projects has typically been at least five years, and often longer.
The court might ask in response to this allegation: Why has the industry standard investment term “typically been at least five years, and often longer,” considering that the law and regulations have only ever name-checked “two years” when discussing the EB-5 sustainment period?
In practice, long holding periods have depended on USCIS capacity problems and visa oversubscription to insert delays in the EB-5 process around conditional permanent residence. The CPR period is the only EB-5 immigration process stage with a firm time attached (two years); all other stages in the process can be very short or extremely long depending on agency processing capacity and workflow and visa availability. The expected EB-5 investment period can vary wildly depending on processing delay plus whether/how the investment period is contingent on immigration milestones.
EB-5 Process Stage
1. Time from I-526 or I-526E petition filing to petition approval
2. Wait time for visa number
3. Time from I-526 or I-526E approval or visa availability to visa issuance
4. Conditional Permanent Residence
5. Time from I-829 filing to removal of conditions for permanent green card
USCIS reports median I-526 process times since 2019 of 19 to 52 months (Total time is determined by USCIS workload and staffing. Adjudication touch time per I-526 is 20.69 hours per USCIS completion rates)
Visa wait time can be extremely long (10+ years), in the proportion that EB-5 applicants exceed annual visa supply.
Historically around 6 months if no delay; can extend to years in case of processing constraints.
USCIS reports median I-829 process times since 2019 of 26 to 49 months (Total time is determined by USCIS workload staffing. Adjudication touch time per I-829 is 15.86 hours per USCIS completion rates)
If the EB-5 process functioned as Congress intended, then the EB-5 investor could complete the immigration process within three years of the time of investment. People are so used to delay that they forget to do the math. Congress set a goal of 120-240 days for the I-526E processing (per the RIA Timely Processing targets, now in 8 U.S.C. 1153 note). After I-526E approval, the investor applies for the visa that initiates a two-year conditional residence period. (This period was set at two years by the Immigration Act of 1990 “to deter immigration-related entrepreneurship fraud”). The visa application is delayed by nothing but USCIS/DOS capacity to move paperwork, schedule interviews, and approve adjustments, unless excess visa number demand forces visa number waits. After 21 months of conditional permanent residence, the investor can file I-829 to remove conditions. I-829 processing is supposed to take about 90 days (2020 Final Fee Rule: “DHS acknowledges its obligation to adjudicate Form I-829 filings within 90 days of the filing date or interview, whichever is later. See INA section 216(c)(3)(A)(ii), 8 U.S.C. 1186b (c)(3)(A)(ii).”) or at any rate <240 days according to the RIA Timely Processing target. So much for government intent.
Investors take longer than three years to complete the EB-5 immigration process if and when (1) processing delays occur and/or (2) EB-5 gets oversold resulting in lengthy wait times for visa numbers. Both problems have been endemic for years, such that actual immigration times have predictably exceeded five or even ten years for many EB-5 investors as noted above. That doesn’t make the immigration delay situation normal or a right, however.
Part of the outrage over the IIUSA lawsuit comes from tacit admission that the plaintiff regional centers rely on the lengthy investment holding periods underwritten by immigration delays, and fighting to keep immigration support for such economically-advantageous holding periods. If established business models rely on an immigration process lasting much longer than two years, then they depend on USCIS processing problems and visa EB-5 oversubscription. That’s the sad fact, given process facts as outlined above. What gives? Will IIUSA sue USCIS for the progress it’s recently made toward realizing the RIA timely processing goals, because accomplishing timely processing could undermine projects that need to hold EB-5 money for much longer than the 3-year delay-free immigration process? Will IIUSA sue USCIS to conceal I-526E filing data, because such data helps avoid the visa oversubscription that can profitably inflate wait times? Will IIUSA advocate against visa relief, because lack of visa wait times would undercut profitably-long holding periods? Of course IIUSA would not consider such steps. But then why try to force lengthy holding periods specifically as an immigration necessity through litigation and rulemaking?
Immigration necessity has never been the only reason for an EB-5 investment decision. The holding period for an EB-5 investment is not simply the minimum period required by USCIS for immigration purposes – however that period may be calculated and defined — but also the time it takes a project to successfully create jobs and support an exit strategy. The promise of a five-year exit strategy is realistically more reliable than the promise of a two-year exit strategy for many types of projects, regardless of the EB-5 context. EB-5 investors have historically been willing to accept the prospect of a five year holding period as reasonable for the types of high-quality projects they want to invest in. Considering what’s practical on the investment side, projects with a two-year duration were likely not common even in the years before EB-5 processing delay. Of the 3,000+ EB-5 investments made since the EB-5 Reform and Integrity Act of 2022, I doubt many were in projects offering a two-year exit strategy, even though such projects have been technically allowable immigration-wise under USCIS interpretation of RIA. Investment holding periods around five years have indeed long been offered by regional centers and accepted by investors as reasonable to the type of investment, regardless of immigration policy.
But the general acceptability of a five-year metric does not make the IIUSA lawsuit right, or the rulemaking likely to succeed. If only a five-year holding period requirement had ever existed in law/policy, then IIUSA might sue USCIS to get it back. But it didn’t; “five years” was only ever an industry tradition. (Seeking an origin for the tradition, all I can find is Canadian government intent for the previously-popular five-year Canadian investor visa program that helped influence early industry expectations for EB-5. I blame Canada.) The only time reference for EB-5 in U.S. law or policy since 1990 was a conditional period defined as two years, though vulnerable to being deferred by processing delays and visa waits. All that IIUSA can sue to get back is a connection between that vulnerability and investor holding periods.
If the IIUSA lawsuit can convince a judge that USCIS invented its Q&A guidance, and that RIA didn’t actually decouple the required two-year EB-5 investment period from the two years of conditional permanent residence, the immediate result would be a return to holding periods indexed to however long it takes to get a visa number and start conditional permanent residence. Such a position could kill the future EB-5 market by reviving the nightmare prospect of redeployment. It could also betray the 3,000+ EB-5 investors who committed to the EB-5 program since the EB-5 Reform and Integrity Act of 2022, investing in reliance both on (1) the holding period specified in the offering, and (2) on the RIA law change, and USCIS confirmation of a minimum holding period not conditioned on immigration delay to conditional permanent residence. Why does industry wait to bring in nearly $3 billion dollars from post-RIA investors (incidentally creating the conditions for visa wait delay), then ask a court to pull the rug out from under the law/guidance that helped attract that investment, and that would protect from immigration delay?
In its statement for the public, IIUSA emphasizes that “Importantly, the purpose of this lawsuit is not to return to the previous sustainment policy that required many EB-5 investors to redeploy their capital for extended periods.” That’s good. However, the IIUSA lawsuit does argue for the previous policy of sustainment through CPR (see for example points 20, 100, 102, and 105 in the complaint). The IIUSA strategy depends on a two-step play to (1) convince a judge that RIA did not actually change the sustainment rules, but also separately (2) convince USCIS to itself change the sustainment rules via formal notice and comment rulemaking. IIUSA suggests to USCIS a fair-looking rule that would delete the CPR link (restoring the generally likeable change that RIA arguably made) while also introducing a 5-year minimum time (thus finally aligning USCIS policy with long-standing industry tradition).
Unfortunately the IIUSA strategy could only deliver on IIUSA intent to avoid previous sustainment policy if the lawsuit fails, or if the USCIS rulemaking process is short and reliable. If the lawsuit wins and rulemaking is slow and unreliable as usual, we’ll be stuck with the old policy IIUSA doesn’t want. For historical context, here’s the timeline of the last EB-5 regulation (EB-5 Modernization): USCIS announced that it was working on an EB-5 rule in 2014 and informally invited stakeholder comments, published the draft rule in the Federal Register as a Notice of Proposed Rulemaking in 2017, accepted public comments in 2017, published a Final Rule in 2019, and vacated the rule in 2021 following industry success in suing USCIS over the rule’s unfavorable content. The USCIS rulemaking process can be shorter than this, but I wonder if anyone can point to an example that took months not years. I also note that the public already provided extensive feedback to USCIS on the sustainment period following invitations to submit comments and questions for USCIS stakeholder meetings and the Ombudsman EB-5 meetings in 2023.
I suggest that plaintiff regional centers should have adopted a less perilous and tenuous strategy: education. If your projects practically need a five-year or longer holding period, then explain that to prospective EB-5 investors in economic terms, just as you’d explain to any investor. Show prospects how your offering is a better/more reliable/more profitable investment opportunity than the other guy who’s offering a shorter term, even if a shorter term is technically allowable under immigration rules. Remind investors that existing and long-standing USCIS guidance puts only a floor but no ceiling to EB-5 investment terms. The USCIS Q&A clearly says: “The INA establishes only minimum required investment timeframes for purposes of applicable eligibility requirements and does not place any upward limit on how long an investor’s capital may be retained before being returned. Regional centers or their associated new commercial enterprises can negotiate longer periods of investment directly with their investors independently of EB-5 eligibility requirements.” Point out that for investment and immigration purposes, the investment term naturally can be and must be as long as it needs to be to economically support required job creation and an exit. The economically-necessary term can plausibly be 5+ years for some if not most excellent projects, even as any promises of near-term exit strategies naturally merit extra scrutiny from investors.
What’s wrong is the attempt to claim or create an immigration necessity for lengthy investment holding periods, and try to force investor decisions in favor of long-term projects by saying that this isn’t just the economic case but what Congress and USCIS actually require for your visa. Such claims flounder for basis, reflect a shameful reliance on processing/visa delay, provoke investor outrage, and hurt the market. Program integrity will particularly suffer if the lawsuit is seen to betray the 3,000+ post-RIA investors who already committed to EB-5 before the lawsuit was filed to challenge USCIS interpretation of RIA, and now thrown into uncertainty and unforeseen exposure to visa-delay-induced redeployment risks beyond their initial agreed investment term. I am willing to believe that IIUSA leadership intended no such outcome, but what can be done to avoid it now that the lawsuit has been filed?