FY2016 EB-5 Visas Stats by Country
March 13, 2017 8 Comments
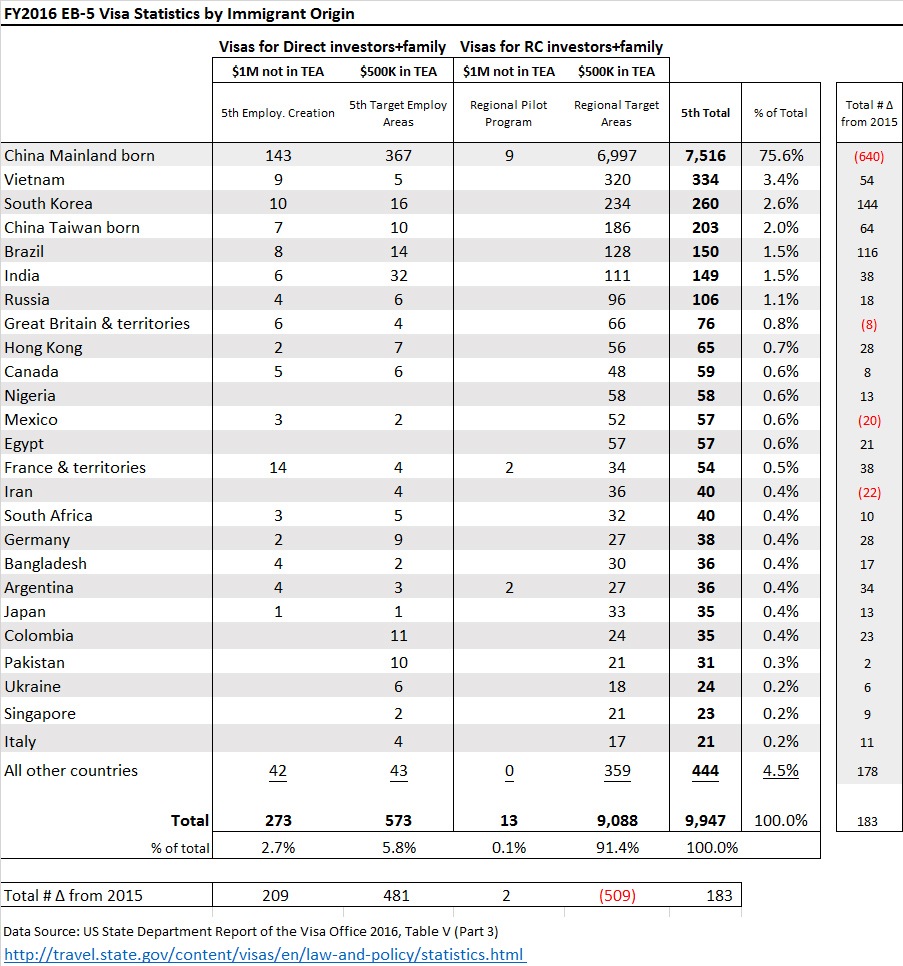
The US State Department Report of the Visa Office 2016 has been updated with Table V (Part 3), which gives a breakdown of all EB visas issued by country in fiscal year 2016. I’ve updated my chart with the EB-5 visa numbers. I’m interested to note the growing number of visas based on direct EB-5 investment (8.5% of the total visas versus 1.6% the previous year), the distribution of TEA investments (99.9% of regional center investments but 68% of direct investments), the growing number of visas going to investors from outside mainland China (24% versus 17% the previous year), and the growing national diversity of EB-5 investors. South Korea and Brazil each claimed over a hundred more EB-5 visas in FY16 than FY15, and five new countries entered the list of those with more than 20 visas each: Germany, Argentina, Colombia, Singapore, and Italy. Considering processing times and the visa backlog, these trends likely reflect EB-5 investments made/I-526 petitions filed in 2014 and earlier. (UPDATE: IIUSA has data on I-526 filings by country in 2016, and you can see additional detail in my post on Q3 2017 petition filings.)
Edit: updated link https://travel.state.gov/content/dam/visas/Statistics/AnnualReports/FY2016AnnualReport/FY16AnnualReport-TableV-Part3.pdf
For reference, here are links to my posts with summary charts of 2014 visa numbers by country and 2015 visa numbers by country.
Discover more from EB-5 Updates
Subscribe to get the latest posts sent to your email.

Please review the case processing times shown on the USCIS site today. Specifically in the IPO office, the I-924 processing time now shows the year as 2016?. Last week it was 2015?
I’m sure this is a typo. Last month they got the year wrong on I-526 times.
hopefully they made the year wrong on I829 too….
Suzanne, Columbia are cities or geographies in the US and Canada. If you refer to the South American country, then is Colombia. 🙂
Oops. Thanks for the correction!
Brazil up from 34 to 150 . How come only increase 124%? Is that correct? Should be 4 times more.
I had used a % difference formula when I should’ve used a % change formula. But anyway I decided to remove that column, as the number difference is what’s practically significant. I appreciate your note!
Hi Suzanne – thanks for all the work on this….that said , can you fix the link just below graphic that looks like it should go to Gov Table V (Part 3)…comes back to this graphic. Cheers