Q3 2017 EB-5 Petition Processing Data
September 21, 2017 8 Comments
The USCIS Immigration and Citizenship Data page has been updated with data from FY2017 Q3 (April to June 2017) for petitions including I-526 and I-829.
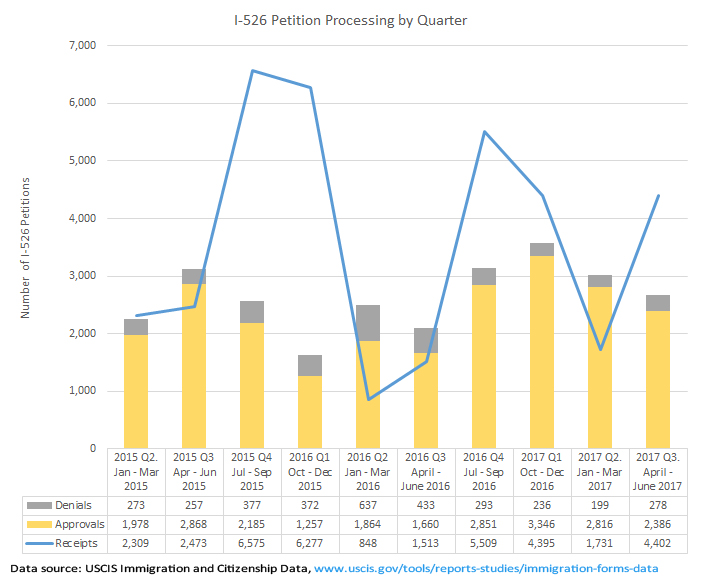

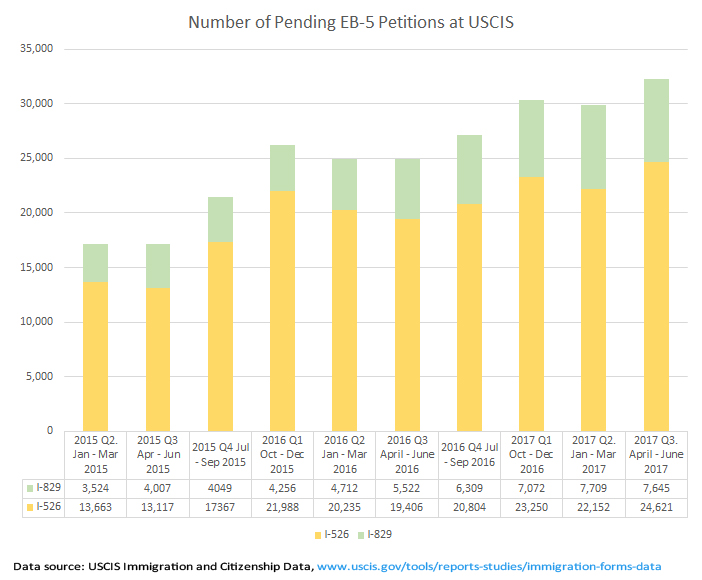
In the third quarter we see IPO making wonderful improvement to I-829 processing volume (likely thanks to the new I-829 team announced in March). Meanwhile, I-526 processing fell another step back (possibly due to resources diverted to I-829). We see another pre-sunset-date filing surge, though less dramatic than previous surges. The total number of pending EB-5 petitions increased again in Q3.
Here’s a bonus chart for people involved in advocacy. Notice how I-526 receipt numbers reflect the destabilizing effect of frequent regional center program sunset dates, with each threatened sunset preceded by a surge of EB-5 investors rushing to file. Notice also how much EB-5 demand has exceeded the EB-5 visa quota as currently interpreted. If about 10,000 EB-5 visas need to be divided by four quarters and three visas per investor, then the program can only afford about 800 new I-526 per quarter on average before facing a backlog situation. If Congress intended to accommodate 10,000 EB-5 investments annually, then an average of 2,500 investor I-526 per quarter would sustainable — and reasonable considering actual demonstrated demand.

EB-5 investors watching processing times should also keep the I-526 receipts chart in mind. IPO has spent a whole year processing I-526 petitions filed from July to December 2015, and is still stuck on November 22, 2015 as of the last two IPO processing time reports. But that’s no wonder considering the huge number of petitions filed July-December 2015. Once IPO finishes that mouthful, dates should advance quickly through the next two relatively light quarters.
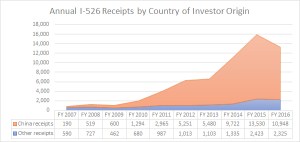
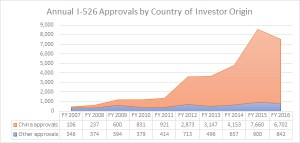
For China-born investors trying to figure out what the I-526 numbers mean for the visa backlog, here are bonus charts with historical approvals and receipts by country in recent years. These numbers can help you guess how many non-China investors are among the currently-reported pending I-526 petitions, and how many of recent approvals went to non-China investors. (In other words, guess how many people will get priority in the visa queue.) I summarized these numbers from a complete dataset of I-526 receipts, approvals, and denials by country for every year since 1991 — a dataset you can purchase from IIUSA for the full detail. (For whatever reason these figures released in response to FOIA request don’t exactly match the totals published on the USCIS website, but still meaningful I think.) (For more detail, download my spreadsheets on statistics related to the visa backlog, and statistics related to I-526 processing times.)
Discover more from EB-5 Updates
Subscribe to get the latest posts sent to your email.

Do you guys think the trends on i829 will improve more for Q4? I know it is almost the end of Q4 for USCIS but just wondering if the new team can do 800 a quarter, they might be able to achieve more in Q4.
The last two processing time reports indicate that IPO advanced through 1.4 months of I-829 in June and 2.5 months of I-829 in July, so that’s a good sign for Q4.
I’ve heard from my Regional center that in August they approved a dozen or more i829 that was file in June 2015, so do you think they really start to have dedicated resources in IPO for i829 processing? instead of borrowing from i526 adjudication team.
on 829 list, it is wrote “D” on the list, why?
If we suppose 7709(Q2 Pending) + 660(Q3 Received) = 7645(Q3 Pending) + 863(Q3 Approved) + D(Q3 Denied) , then D = -139???
I think D should including both withdrawed and denied cases
So -139 means 139 cased withdrawed on Q3? then the rate for withdrwal will be 13.9%
same calculation on Q2, then D=-228个,which means withdrawal rate=38.4%?
The notes on the USCIS report explain that “D” means “Data withheld to protect applicants’ privacy.” My impression is that it’s used for quarters when there are only a handful of denials to report. For example FY 2016 Q4 reported “D” denials, but we can calculate from total denials for the FY2016 that there were 6 denials that quarter. The equation you use always calculates a different number of pending petitions than reported by USCIS, even without the mystery “D” variable. See this spreadsheet: https://www.dropbox.com/s/8mwqwwh5eos0j96/PendingCalc.xlsx?dl=0 I do not know why this is so.
What is your estimated time of approval for I-829 submitted in Sep 2016? Thx
I don’t have a good model to answer this question, but you can try to make one from the filing data in this post and historical processing times (which I’ve recorded here https://www.dropbox.com/s/dfa4ifgop1vhm63/IPO%20Times%20Dates.xlsx?dl=0)
Any estimate of processing time for a U.K. I-526 received by USCIS September 2016. Is it still 1.113 years as per your estimate or are there other factors that will affect?