The Trump administration has put immigrant investment in the spotlight and crosshairs, with discussions in the Oval Office yesterday and at a cabinet meeting today that talked up a potential new “Gold Card” immigration path, and mentioned EB-5. You can go to social media and your favorite advisors to get “what does this mean for EB-5 investors” analysis and reassurance, and all the alarming new developments. (A few good articles so far: “Will the Gold Card be a Wrecking Ball for the EB-5 Industry” (March 2, 2025) by Matthew Galati and Halston Chavez in IMI Daily, and “Trump’s Gold Card Plan Has Benefits But Legal and Practical Obstacles” (February 26, 2025) by David Bier for Cato Institute.)
What I have done is to transcribe exactly what President Trump and Commerce Secretary Howard Lutnick have said in two events so far, for everyone’s reference. [With on-going updates as the topic continues to be discussed.]
- From February 25, 2025 remarks by President Trump and Howard Lutnick in the Oval Office
- From February 26, 2025 remarks by President Trump and Howard Lutnick during the First Cabinet meeting
- From February 26, 2025 remarks by Howard Lutnick in an interview with Fox News Bret Baier
- From February 28, 2025 interview of President Trump by Ben Domenich of The Spectator
- From March 5, 2025 remarks by President Trump addressing a joint session of Congress
- From March 9, 2025 remarks by President Trump in an interview with Fox News Maria Bartiromo
- From March 19, 2025 remarks by President Trump in an interview with Fox News Laura Ingraham
- From March 20, 2025 remarks by Howard Lutnick in an interview with All-In In DC podcast
- From April 3, 2025 remarks by President Trump aboard Air Force One
- From April 10, 2025 remarks by Howard Lutnick, Elon Musk, and President Trump and during the Second Cabinet meeting
- From May 21, 2025 remarks by Howard Lutnick in an interview with Mike Allen
- From June 11, 2024 announcement by President Trump on Truth Social
In the worst case that Congress believes in “Gold Cards” as a spending offset tool and hastily makes them law (reportedly possible as part of the budget reconciliation process) [UPDATE: but not in the draft released on March 8], then at least we’ll have a record of what was said, to hold our representatives to account. And in the best case that the preliminary ideas just introduced get more time to bake, the transcript sets an agenda of misconceptions to address, facts to correct, and objectives to support. The President’s remarks highlight immigration goals that are great points of departure for explaining what’s good about existing EB visa categories.
Reading the transcript, I note that the President and Secretary Lutnick are currently expressing different visions for immigrant investment. The President is focused on a Gold Card “green card for sale” idea, with a range of objectives from deficit reduction to helping companies employ talented young graduates. The President did not name or allude to EB-5 (at least in the meetings I transcribed so far). In fact the President spoke warmly about advantageous types of immigration that could be supported by his Gold Card, without seeming to realize that such good immigration is already happening under EB-1, EB-2, EB-3, and EB-5, only constrained by not enough visas to support it. Meanwhile the Commerce Secretary was negatively focused on EB-5, suggesting yesterday that EB-5 would be eliminated and replaced by the Gold Card, and today suggesting that EB-5 would be moved to his department, with contradictory statements on whether it would then be a project investment or a buy-a-green-card program. It wasn’t clear from either that the Gold Card and EB-5 are necessarily interrelated or mutually exclusive.
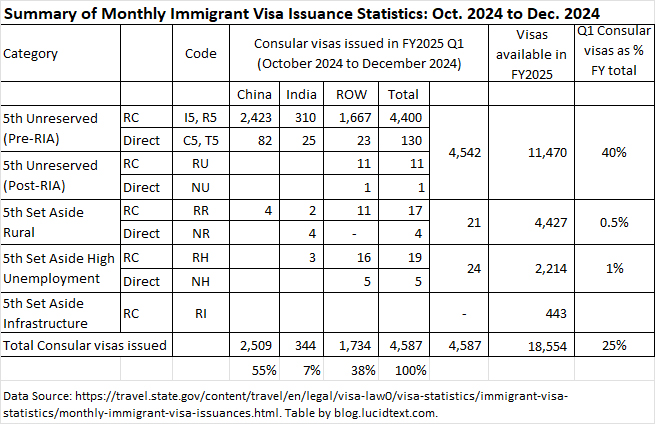
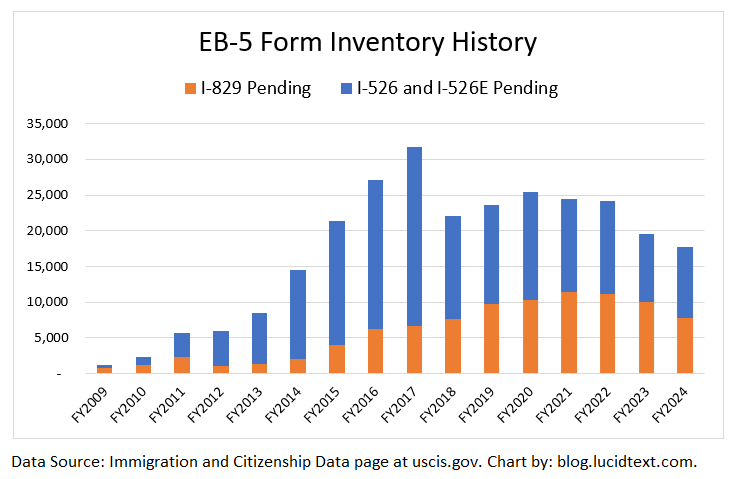
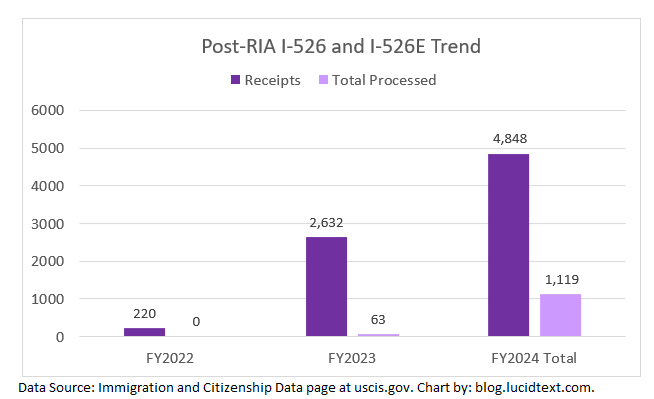
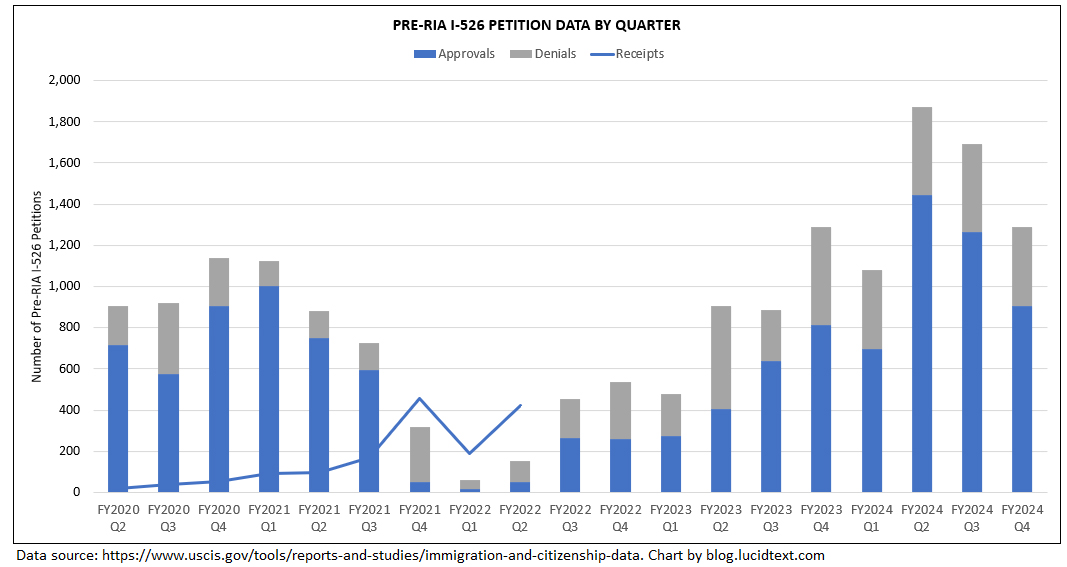
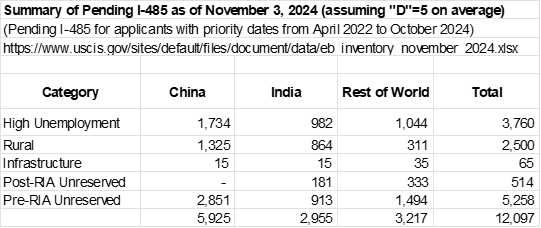
I could spend infinite time fact checking the following transcript – pointing out actual worldwide wealth and migration data, the Law of Demand, what’s in current immigration law, what EB-5 does and how tightly it’s regulated, the political and economic differences between EB-5 investment and buying a green card, the negative impact of other high-ticket gold card programs… But would it matter? Does the President need to put forward a Gold Card possibility and repeatedly say that there could be 1 to 10 million wealthy people eager to buy it, thus raising at least $5 trillion for the government, because his tax priorities are estimated to reduce revenue by at least $5 trillion? Does it matter that realizing the deficit elimination objective would require the participation of real aliens, since our planet only has about 600,000 ultra high net worth individuals ($30M+ net worth) and about 2.3 million people with $5M+ net worth, of whom over a third are already in the US? Perhaps the President has the number $5 million in mind because it’s reportedly what people are eager to pay for access to eat dinner with him. I note that top global migration expert Christian Nesheim is optimistic that a $5M Gold Card to the U.S. might get 100+ takers a year if accompanied by quick processing times — which would be $500 million in revenue as compared with the $3.9 billion in revenue generated by EB-5 last year by 4,848 investments at $800,000 each. (Also noting by the way that the real-life EB-5 wait line has five times fewer visa applicants — i.e. 10+ times fewer investors — than the 250,000 number that Secretary Lutnick made up on the fly.)
Before moving on to the transcript, I’d like to remind everyone of my PayPal link. If you benefit from articles like this and would like me to keep reporting and keep the work public, please consider a voluntary donation to support the blog.
[Minute 24:38-30]
Media: Mr. President, there are approximately 2 million federal employees right now. At the end of your term, what do you expect that number to be? What would you like that number to be?
President Trump: It will be lower, but I can’t tell you. Everybody knows that I ran on downsizing government, but making government better. I ran on tariffs and making our country rich, and that’s what I’m going to do.
We’re going to be doing something else that’s going to be very very good. We’re going to be selling a gold card. If you have a green card, this is a gold card. We’re going to be putting a price on that card of about $5 million dollars, and that’s going to give you green card privileges plus it’s going to be route to citizenship. And wealthy people will be coming into our country by buying this card. They’ll be wealthy. And they’ll be successful. And they’ll be spending a lot of money and paying a lot of taxes and employing a lot of people. We think it’s going to be extremely successful. Never been done before anything like this. But it’s something that we’re going to be putting out over the next, would you say, two weeks, Howard? Would you like to say something about it?
Media: Do you have to invest a certain amount of money in the country in order to qualify for that gold card?
President Trump: Yes, exactly.
Commerce Secretary Howard Lutnick: So the EB-5 program, was really, you lend some money, but it was all, it was full of nonsense, make believe, and fraud. And it was a way to get a green card that was low priced. So the President said rather than having this sort of ridiculous EB-5 program we’re going to end the EB-5 program. We’re going to replace it with the Trump Gold Card which is really a Green Card Gold so they’ll be able to pay $5 million dollars to the U.S. government. They’ll have to go through vetting of course, we’re going to make sure they’re wonderful world class global citizens. They can come to America. The President can give them a green card. And they can invest in America. And we can use that money to reduce our deficit. Why do we give out lotteries of green cards. Why do we give out EB-5 for green cards. The President of the United States understands that the right answer is “why don’t we eliminate the deficit of the United States of America instead.”
President Trump: The Gold Card will bring in with it people that create jobs, very high level people. I think companies will pay to get people in. Since you today graduate from the Wharton School of Finance or Harvard or Stanford or any college and nobody knows if you can even go to work for a company. So Apple and all these companies that want to get people to be working for them will be able to buy a card. And for the people that are number one in their class at top schools, I see that as one of things.
But generally speaking it will be people with money and people that create jobs. And they won’t have to pay any tax on income outside of the United States. Which they’re not paying right now, they’re not citizens. But they’ll have to pay if they create jobs in the United States – they’ll pay full taxes like everybody else. So you’re getting big taxpayers, big job producers. And we’ll be able to sell maybe a million of these cards, maybe more than that. And if you add up the numbers, they’re pretty good. As an example, a million cards would be worth $5 trillion dollars. $5 trillion.
Secretary Lutnick: Wow!!
President Trump: And if you sell 10 million of the cards, that’s a total of $50 trillion dollars. Well we have $35 trillion in debt – that would be nice. So we’ll see. But it could be great. Maybe it will be fantastic. We have it all worked out from the legal standpoint. It’s totally legal to do. It hasn’t been done before. It’s been done in many different forms. We give them away. Why should we give them away. We shouldn’t give them away. And I think it’s something very exciting. I think it’s potentially something that we’re all very excited about.
So it is a gold card. It is somewhat like a green card but a higher level of sophistication. It’s a road to citizenship for people, and essentially people of wealth or people of great talent, people of wealth pay for people of talent to get in. Meaning companies will pay for people to get in and to have long-term status in the country. I think that is something we are very, very happy about. You have anything to say about that?
Secretary Lutnick: Many other countries do this, by the way, including, of course your 51st state does that.
Media: The money is earmarked for deficit reduction?
President Trump: It may be earmarked for deficit but it actually could be more money than that. I mean if you did $10 million, you’d have $15 trillion left over. But generally it’s going to be paid down debt, yes.
Media: Do you need Congress for this?
President Trump: No, we don’t need Congress. Because we’re not doing citizenship, we’re doing the card. It’s a path to citizenship, a very strong path to citizenship. But we’re not doing citizenship – for that I would have to get Congress.
Media: And would all countries be eligible for this gold card?
President Trump: It depends. Countries largely. The people will be vetted very carefully.
… [Minute 34:17 – 36]
Media: Have you lifted any sanctions on Russia?
President Trump: No, we haven’t lifted any sanctions on anyone.
Media: Is that part of the negotiations?
President Trump: I guess it will be at some point, but right now we haven’t agreed to lift sanctions on anybody.
Media: That gold card, getting back to that. I’m fascinated by that.
President Trump: You should be fascinated. Your taxes will go down to nothing.
Media: Would a Russian oligarch be eligible for a gold card?
President Trump: Yeah, possibly! Hey, I know some Russian oligarchs that are very nice people. It’s possible.
Secretary Lutnick: Heh heh heh.
President Trump: They’re not quite as wealthy as they used to be.
Secretary Lutnick: Heh heh heh heh heh.
President Trump: I think they can afford 5 million dollars. A lot of people are going to want to be in this country. And they’ll be able to work and provide jobs and build companies and pay taxes. All of those things. It’s an incredible thing. This is the group who is the first to hear it. Nobody’s heard about it. Nobody’s ever thought about it. But we’ve been thinking about it very strongly over the last week. And I was going to announce it sometime next week, and I figured why not, we have a lot of cameras blazing right now, might as well do it now. We’ll have Caroline announce it the next time. No, it’s a great thing, the gold card. Remember the words, the gold card. Somebody said, can we call it the “Trump Gold Card”? I said “If it helps, use the name Trump, I’ll give it to you for free.”
Media: You probably just launched 10,000 stories. Do you want to elaborate a little more on what Russian oligarchs you know?
President Trump: I know. Isn’t it interesting how many stories we do tell? And they all turn out to be true.
Secretary Lutnick: Heh heh heh heh
President Trump: And they all turn out to be ultimately correct. Trump was right about everything. Do you have one of the “Trump was right about everything” hats? I’m going to give it to this gentleman. Get me one of those.
Secretary Lutnick: But they’re all going to be vetted. Everybody who comes in gets vetted, ok, they get vetted. So you gotta, you know…
Media: When does this begin?
Secretary Lutnick: We’re going to begin in two weeks.
President Trump: About two weeks. The sale will start in about two weeks.
Secretary Lutnick: Heh heh heh heh
[starting at about minute 20] [2/27 UPDATE: text now replaced from the transcript published by the White House in Remarks by President Trump before Cabinet Meeting]
Q Mr. President.
Q About the — the Trump gold card idea —
THE PRESIDENT: Yeah.
Q — that you unveiled yesterday.
THE PRESIDENT: I hope you liked it. (Laughter.)
Q I await more information. But the question is: Does this reflect a view, on your part, that the American immigration system has never been properly monetized as you feel it should be?
THE PRESIDENT: Well, not so much monetized. It hasn’t been properly run. I get calls from, as an example, companies where they want to hire the number one student at a school. A person comes from India, China, Japan, lots of different places, and they go to Harvard, the Wharton School of Finance. They go to Yale. They go to all great schools. And they graduate number one in their class, and they are made job offers, but the offer is immediately rescinded because you have no idea whether or not that person can stay in the country. I want to be able to have that person stay in the country.
These companies can go and buy a gold card, and they can use it as a matter of recruitment.
At the same time, the company is using that money to pay down debt. We’re going to — we’re going to pay down a lot of debt with that.
Q Are they going to have to —
THE PRESIDENT: And I think the gold card is going to be used by — not only for that. I mean, they’ll be used by companies. I mean, I could see Apple — I’ve spoken with Tim Cook — and, by the way, he’s going to make a $500 billion investment in the country only because of the results of the election and, I think, because of tariffs. He’s going to want to be in the country because of tariffs. Because if you’re in the country, there is no tariff. If you’re out of the country, you got to pay tariffs. And that’s going to be a great investment, I think, that he’s making. I know it’s going to be a great investment.
But we have to be able to get people in the country, and we want people that are productive people. And I will tell you, the people that can pay $5 million, they’re going to create jobs. They’re going to spend a lot of money on jobs. They’re going to have to pay taxes on that too. So, they’re going to be hiring people, they’re going to be bringing people in and companies in. And, I don’t know, maybe it will sell like crazy. I happen to think it’s going to sell like crazy. It’s a bargain.
But we’ll —
Q Will they have to commit to a certain number?
THE PRESIDENT: — know fairly soon. I think Howard and — and Scott — a few of you, really, are responsible for it. But, Howard, if you want to discuss that for a couple of minutes, I think I’d like to have you. I think it’s going to be a very successful program.
SECRETARY LUTNICK: Sure.
THE PRESIDENT: This is Commerce.
SECRETARY LUTNICK: So, the EB-5 program, which has been around for many years, had investment of a million dollars into projects in America. And those projects were often suspect, they didn’t really work out, there wasn’t any oversight of it. And so, for a million-dollar investment, you got a visa, and then you came into the country and ended up with a green card.
So, it was poorly overseen, poorly executed. Then you had our border open, where millions of people came through.
So, the idea is we will have a proper business. We will modify the EB-5 agreement. Kristi and I are working on it together. For $5 million, they’ll get a license from the Department of Commerce. Then they’ll make a proper investment on the EB-5, right? And we think Scott and I will design the EB-5 investment model, because Scott and I are the best people together to do that. So, this is joint.
This is exactly the Trump administration. We all work together. We work it out to be the best. And if we sell — just remember — 200,000 — there’s a line for EB-5 of 250,000 right now — 200,000 of these gold green cards is $1 trillion
to pay down our debt, and that’s why the president is doing it, because we are going to balance this budget, and we are going to pay off the debt under President Trump.
Q Mr. —
Q And to qualify, do you have to promise and make commitments to create a certain number of jobs here in the U.S.?
THE PRESIDENT: No. No. Because not all these people are going to be job builders. They’ll be successful people, or they’ll be people that were hired from colleges, like — sort of like paying an athlete a bonus. I mean, Apple or one of the companies will go out and they’ll spend five mil- — they’ll buy five of them, and they’re going to get five people.
Look, I’ve had the complaint where — I’ve had the complaint from a lot of companies where they go out to hire people, and they can’t hire them b- — out of colleges. And you know what they do? They go back to India, or they go back to the country where they came, and they open up a company, and they become billionaires. They become — and they’re employing thousands and there are a lot of examples.
There are some really big examples where they were forced out of the country. They graduated top in their class at a great school, and they weren’t able to stay. This is all the time you hear it.
And the biggest complaint I get from companies, other than overregulation, which we took care of, but we’re going to have to take care of it here, because a lot of that was put back on by Biden. But the biggest complaint is the fact that they can’t have any longevity with people. This way, they have pretty much unlimited longevity.
Also, with the $5 million, you know, that’s a path to citizenship. So, that’s going to be — it’s sort of a green card-plus, and it’s a path to citizenship. We’re going to call it the gold card. And I think it’s going to be very treasured. I think it’s going to do very well. And we’re going to start selling, hopefully, in about two weeks.
Now, just so you understand, if we sell a million — right? — a million, that’s $5 trillion. Five trillion. Howard was using a different number, but that’s $5 trillion. If we sell 10 million, which is possible — 10 million highly productive people coming in or people that we’re going to make productive — they’ll be young, but they’re talented, like a talented athlete — that’s $50 trillion.
That means our debt is totally paid off, and we have $15 trillion above that. And — now, I don’t know that we’re going to sell that many. Maybe we won’t so many at all. But I think we’re going to sell a lot, because I think there’s — there really is a thirst.
No other country can do this, because people don’t want to go to other countries. They want to come here. Everybody wants to come here, especially since November 5th. (Laughter.)
(Cross-talk.)
SECRETARY LUTNICK: They’ll all be vetted, by the way. All these people will be vetted.
Q How?
SECRETARY LUTNICK: Okay? They’ll be vetted.
…
Q On the gold cards, sir. Can you talk a little bit more about the vetting process, you know —
THE PRESIDENT: They’ll go through a process. The process is being worked out right now, and we’re going to be — we’re going to be very careful.
Q And will there be restrictions on, for instance, can Chinese nationals get one?
THE PRESIDENT: No, we’re not going to restrict.
Q Can Iranian nationals get —
THE PRESIDENT: We’re probably not going to be restricting too much in — in terms of countries, but maybe in terms of individuals. We want to make sure we have people that love our country and are capable of loving the country.
Q Is there a process, sir —
Q Mr. President, there is a measles outbreak in Texas at the moment in which a child is reported to have died. Do you have concerns about that? And have you asked Secretary Kennedy to look into that outbreak?
THE PRESIDENT: Well, why don’t we — Bobby, do you want to speak on that, please?
Baier: Commerce Secretary, Howard Lutnick, thanks for having us here at the Commerce Department.
Lutnick: Great to be with you.
Baier: How’d that cabinet meeting go today? First one!
Lutnick: It was so fun. We have such a great cabinet. There’s great camaraderie. The feeling is just fire. And this administration is winning. Every day it’s winning.
Baier: Let me talk about what you were talking about there the EB-5 program, which is gold, green cards, $5 million that essentially gets you a pathway to citizenship. Explain, first of all, how that came to be.
Lutnick: So there’s an EB-5 program that always had, if you invest in real estate or make a loan in America, you get a path to citizenship with a green card. And so the President had conversations over the weekend with his friend John Paulson, who came up and said, “Hey, why aren’t we doing better with that?” He called me. We talked about it, and I did work over the weekend, on Monday and on Tuesday, at a press conference, the President comes out and gives the path, which says, imagine if we sell a million of them, that’s $5 trillion and that pays off our debt, drives down interest rates and makes America amazing.
Baier: So the coverage of it, you know, Trump gold card to offer rich foreigners route to US citizenship for 5 million; Trump says us can pay off $36 trillion debt by selling wealthy immigrants $5 million gold card visas. And then Politico took another take: “Trump: I know some Russian oligarchs that are very nice people.” What do you say to people who say…
Lutnick: Come on….
Baier: Yeah, no, not about that. Are they going to be vetted?
Lutnick: First of all, of course, deeply vetted. And we said that from the first minute go. These are vetted people. These are going to be great global citizens who are going to bring entrepreneurial spirit, capacity and growth to America. If one of them comes in, think of the jobs they’re going to bring with them, the businesses they’re going to bring with them, and they’re going to pay American taxes as well. So this is huge money for America.
Baier: And how many people are waiting in this line currently?
Lutnick: So there are 250,000 people waiting in line. Now, if they’re willing to pay the 5 million, that’s over a trillion dollars. That comes directly to $1,250,000,000,000 just for that line. And I think these people are going to come enormous ways, because they know they can come into America, and they can be in the greatest country on Earth.
Baier: You’re kind of bullish when you talk about paying down the debt, and you said it again today in the Cabinet meeting, you truly believe that with this program, with DOGE, you can make this money all materialize and counteract a really skyrocketing deficit.
Lutnick: So if you go back to my Twitter feed, which I’m sure no one does, but October 14, when I recruited Elon and came up with the name DOGE, October 14, we agreed to balance the budget that he would take a trillion of expense out. Remember, we have just under $4 trillion of entitlements, but no one’s ever gone through it. No one’s ever looked at it. If I told you, no one’s ever, ever, ever, ever looked at it, you’ve got to assume 20, 25% is just mistakes, errors, and it’s wrong. That’s a trillion dollars a year. We do tariffs, we do the gold card, we drill, baby drill, and we get rid of these tax scams that are all over the United States of America, and that will produce a trillion in revenue, trillion in cuts, and a trillion in revenue and it balances this budget, and we’re going to do it.
BD: Was it more important for you to use that to balance the budget than to do other things?
DJT: Well. I think a big sleeper is going to be this gold card. It’s an idea I had. I think this could be a very big bridge. If you sell, let’s say, a million at 5 million, that’s $5 trillion. The budget’s almost going to be balanced. It’s not going to be that far short. It’s going to make $5 trillion. That’s part of you know, that’s part of the—
BD: How do you ensure that that’s something that doesn’t get exploited by the wrong people?
DJT: It’s so simple. You know, the other stuff, the different programs you put money in and you can build a building and you get a mortgage, and this and that. Oh, yeah-yeah. You can imagine what’s going on. “I think we’re going to terminate the program,” they say, “it’s just so terrible.” This is very simple. Five million and you have a path to citizenship. You essentially get a green card plus. It’s a green card plus. It’s a gold card. And you have a plan. If we did a million, it’s a lot. Now, if we did 10 million, that’s $50 trillion. Ten million. You know, if that thing exploded, you had people that would pay that. Yeah, I have people all the time begging me to help them get into the country. Some of them are very wealthy people. They’d pay that in two minutes.
Starting at about 1:10:00
THE PRESIDENT: More than 100 years older than our country.
But we’re going to find out where that money is going, and it’s not going to be pretty.
By slashing all of the fraud, waste, and theft we can find, we will defeat inflation, bring down mortgage rates, lower car payments and grocery prices, protect our seniors, and put more money in the pockets of American families. (Applause.)
And today, interest rates took a beautiful drop — big, beautiful drop. It’s about time.
And in the near future, I want to do what has not been done in 24 years: balance the federal budget. We’re going to balance it. (Applause.)
With that goal in mind, we have developed in great detail what we are calling the gold card, which goes on sale very, very soon.
For $5 million, we will allow the most successful, job-creating people from all over the world to buy a path to U.S. citizenship. It’s like the green card but better and more sophisticated. (Laughter.) And these people will have to pay tax in our country. They won’t have to pay tax from where they came. The money that they’ve made, you wouldn’t want to do that, but they have to pay tax, create jobs.
They’ll also be taking people out of colleges and paying for them so that we can keep them in our country, instead of having them being forced out. Number one at the top school, as an example, being forced out and not being allowed to stay and create tremendous numbers of jobs and great success for a company out there.
So, while we take out the criminals, killers, traffickers, and child predators who were allowed to enter our country under the open border policy of these people — the Democrats, the Biden administration — the open border, insane policies that you’ve allowed to destroy our country — we will now bring in brilliant, hardworking, job-creating people. They’re going to pay a lot of money, and we’re going to reduce our debt with that money. (Applause.)
Quoted from President Trump interview with Maria Bartiromo on Fox Sunday Morning Futures on March 9, 2025 (starting at about Minute 2:12)
Bartiromo: So we’re coming up — Congress is doing this reconciliation package. When you look at where the spending is, 76% of the spending is going to the mandatory programs. Don’t you have to really cut into those mandatory programs in order to really make a dent? You say you’re going to balance the budget. You can’t balance the budget just by DOGE cuts, right?
Trump: We’re going to have growth like you’ve never seen before.
Bartiromo: That’s true, you said that.
Trump: We’re going to have growth. I’m not going to touch Social Security, Medicare, Medicaid. Now we’re going to get fraud out of there. … And I’m doing something else that I think is very exciting. Maybe I’m wrong. A Gold Card. For $5 million you buy a path to citizenship in this country. We’ll see. I believe that Apple and all these companies that can’t get people to come out of college and come cause they get thrown out – think of it, you graduate number one at the Wharton School of Finance or Harvard or Stanford and you get thrown out of the country, you can’t stay more than one day. And they want to hire these people, but they can’t. They’ve complained to me about it. Now they can buy a Gold Card. And they can take that Gold Card and make it a part of their deal to get these top students. No different than an athlete. It’s like a bonus, a signing bonus. And you’re going to have a lot of people buy that. You’re going to have a lot of companies buying Gold Cards. So for $5 million – now, it’s a lot of money if you add it up, if you sell a lot of them. If we don’t, it’s nothing ventured nothing lost. But I think it’s very successful. You can’t get a green card. This would be a green card on steroids. This would be much better than a green card.
Bartiromo: How do you know the Chinese are not going to take advantage of it and exploit it? They do that with student visas.
Trump: They may. They may. But they don’t have to do that. They can do it in other ways.
Bartiromo: Look, the Democrats say that Elon Musk and DOGE are overstepping their bounds. …
Trump: Now they’ve got a new one. We’re going to back murderers, killers and people that hate our country. We’re going to back people that hate Israel. Want to destroy it, people that are murderers, people that are horrible. We’re going to back them. I think that might be a 100% issue for us. They don’t ever find an issue that’s like a politically, very politically– I mean, backing Khalil is not a great issue, but backing Khalil is better than backing these other you know, hundreds of people that are really serious criminals. It’s probably a step better than that.
Ingraham: The EB-5 visas, you’ve spoken about them and the fraud and abuse of that process over years. They’re basically immigrant investment visas. $800,000 you can get a fast track to a green card. You don’t have to speak English, you don’t have to have a special skill. But it’s very popular. It’s a big, long line of people waiting to get these.
Trump: We’re going to have one that’s much more popular.
Ingraham: But the golden visa, which you also you’re obviously backing, probably is going to have to go through Congress. We’ll see if they actually do that. But $5 million investment from a foreigner coming into the United States. Why should our citizenship be purchased for any amount of money, especially given the fact that you’re America First, given the types of people who have $5 million to throw down for a visa or for a permanent residency?
Trump: That’s why, because I’m America First, because at $5 million you’re getting a lot of things, but you’re getting $5 million. Let’s say we sell a million of them. That’s $5 trillion. We are now an unbelievably successful country paying down tremendous amounts of debt. It’s all going to pay down debt. We’re going to have very little debt. But if you did think of it, if you did $5 million– Now, generally, people that can pay $5 million are going to be job producers. Okay, they’re going to be successful. They’re going to produce jobs. But here’s another thing, Apple comes to me. A lot of companies come to me, they say, Sir, we just made a deal to hire the number one student at the Wharton School of Finance or at Harvard Business School, or anything else, or MIT, or Stanford, or any– But they’re going to throw them out of the country the day after graduation. They’ll buy these.
Ingraham: Why should any American–?
Trump: By the way, they’re going to call it either the gold card– The problem is, there are many gold cards. I will tell you what my people want to call it. It’ll drive you crazy. It’ll drive the Left crazy. They want to call it the Trump Card, because the Trump Card sells much better than the gold card. Everybody has–
Ingraham: You’re not worried about any unsavory people coming in and taking–
Trump: Yeah, I’m worried about unsavory. In which case we’re going to–
Ingraham: They’re going to be vetted.
Trump: Give them the money back, and they get out.
Ingraham: They’ll be properly vetted.
Trump: They’re going to be properly vetted. But, you know, here we are talking about a lot of people. I think it’s going to be very successful. If somebody’s wrong, we get– we are actually very, very nice, because it makes it a lot easier legally. We give them that money back and we send them out.
Q: Speaking of potentially great ideas, can you tell us about the Trump card.
Lutnick: Sure
Q: So whose idea was that? And how did that come about?
Lutnick: John Paulson had a call with Donald Trump and was talking to Donald Trump and was kicking around the idea of — we should sell. Right. Why do we give away visas? We should sell them. And they’re talking about it. And Donald Trump calls me, gets me on the phone. Right? We all talk about it. Right? And then we go from there. And then my job is to figure out, like I always figure out, how to do it. What’s the path? Let’s go figure it out. Of course, about two weeks from today it goes out. Okay Elon’s building me the software right now. Right. And then out it goes. And by the way, uh, yesterday I sold a thousand.
Q: Oh you did? I got a poly market I created on how many are you guys going to sell this year, So yeah Curious to see how many.
Q: Cool. That’s fantastic. Do you want to tell people just the rough terms?
Lutnick: Okay. So if you’re a US citizen you pay global tax. So you’re not going to bring in outsiders, going to come in to pay global tax. So if you have a green card — which used to be a green card now gold card — you’re a permanent resident of America. You can be a citizen but you don’t have to be. And none of them are going to choose to be. What they’re going to do is they’re going to have the right to be in America. They’d be $5 million and they have the right to be an American. They have the right to be an American as long as they’re good. As long as they’re good people
Q: And they’re vetted
Lutnick: And they’re vetted. And they can’t break the law. We could always take it away if they’re like evil or mean or bad or something. Not mean. But you know if they do something horrible, you could take it away, right? But the idea is if I was not American and I lived in any other country, I would buy six. One for me one for my wife and my four kids because God forbid something happens, I want to be able to go to America and I want to have the right to go to the airport to go to America and them to say “hello Mr Lutnik, Hello Mr Lutlnick and the Lutnick family, Welcome home.” Right? That’s what I want to hear. I don’t want to hear I can’t come here when there’s a you know a a horrible war a horrible whatever? I want to be able to go home, right. And once I’m home – ehhhh, I might as well build a business. So you have the most productive people in the world going to start spending time here. They’re going to have a family office. They’re going to hire some people.
Q: And you’re not going to tax their external worldwide income.
Lutnick: I only tax the money they make in America. Which is what we do now. But their global income stays out.
Q. And they pay 5 million.
Q: And how many people do you think there are that could qualify in the world? How many—
Lutnick: There are 37 million people in the world who are capable of buying the card. In case you were wondering.
Q: 37 million. That’s a lot more than Chat GPT told me.
Lutnick: Who are capable of buying.
Q: Who are capable of buying it.
Lutnick: Now I’m not saying they will but they’re capable of buying.
Q: How many do you think he’ll sell?
Lutnick: Uh the president thinks we can sell a million So five trillion dollars.
Q: I think a million is reasonable.
Q: I mean look as an outsider who came in and got his green card and then got his citizenship and now pays global tax every which way known to man. If this were available 15 years ago after the Facebook IPO that’s what I would have done. It would have been much better for me theoretically. Now I’m happy I’m happy to pay the tax.
Lutnick: So the idea, So the idea is um– and it’s going to go fast. Meaning you apply, right? We take your money. And you know the way computers work now. They have these cool things, like these computer things. They’re amazing. You like you know you put stuff in and they actually check everything. It’s– It’s fantastic. I don’t–You don’t even have to plug them in anymore. It’s amazing. Like they get them– they get the information through the air. I mean you could do a better vet than anybody in government has ever done it before in one second, right? Better than they’ve ever done it before.
President Trump: Five million. For five million dollars this could be yours. Notice the person on the card. You know what that card is? It’s the Gold Card. The Trump Card Gold Card.
Media: Who’s the first buyer?
President Trump: Me. I’m the first.
Media: Who’s the second?
President Trump: I don’t know. But I’m the first buyer. It’ll be out in about– less than two weeks. Pretty exciting, right?
00:06:12-00:06:17 (6 sec)
Howard Lutnick
We’re getting the respect we deserve now and I think you’re going to see historic deals one after the other.
And then I’m very excited that with a week and a half we’re going to start with the Gold Card and the Trump Card. It’s coming out. And we’re very excited about that, and that’s coming soon. So very excited.
Donald Trump
Thank you very much. Good job. Linda?
…
00:32:16-00:32:34 (18 sec)
Elon Musk
So um, so I think we’re doing a lot of good uh, an excellent collaboration with cabinet to achieve these savings. And it will actually result in better services for the American people. Um, and that we’re going to be spending their tax dollars in a way that is sensible and fair and good.
Donald Trump
And your people are fantastic. In fact, hopefully they’ll stay around for the long haul. We’d like to keep as many as we can. They’re great. Smart, sharp, right?
Unidentified
Yes.
Donald Trump
Finding things that nobody would have thought of. Very computer savvy.
Unidentified
Yes. 100 percent.
Elon Musk
And we’re working hard to get that the Trump gold card operational hopefully in the next week or so.
Donald Trump
That’ll be good.
Unidentified
Incredible.
Donald Trump
That’ll be very exciting.
Unidentified
It’s really exciting.
Donald Trump
That’s a pathway to citizenship into the United States. It’s —
Unidentified
Yeah.
Elon Musk
It’s a big deal.
Donald Trump
Yeah, it’s a big deal. Thank you very much. Great job you’re doing.
Mike Allen: Secretary, you promoted the Trump Gold Card, which makes it possible for you to get a visa for $5 million. I think you said, when you’re out to dinner, someone asked you for 10, keep the change. When is this Trump Gold Card coming?
Howard Lutnick: So they’ll I expect there’ll be a website up called trumpcard.gov in about a week.
Allen: So this is news.
Lutnick: Oh yeah. And then, and then the details of that will come soon after. But people can start to register. And all that will come over a matter of the next weeks — not months, weeks.
Allen: How many have you informally sold or pre cleared, or however you think–
Lutnick: So I’m in the Middle East. I’m at one of these giant dinners. There’s 400 people at this giant dinner, and everyone’s really respectful. And I have my phone out, you know? And so someone says, so one of the senior leaders walks by, and they go why do you have your phone out? I go, I’m selling cards. So Okay, so basically, everyone I meet who’s not an American is going to want to buy the card if they have the fiscal capacity. Because why wouldn’t you want to be able if something bad happens?
Allen: Haha.
Lutnick: Well, I’m not saying – Right, for those who can afford to help America pay off its debt, right? This is for people who can help America pay off its debt. Why wouldn’t you want a Plan B that says, God forbid something bad happens, you come to the airport in America and the person in immigration says, Welcome home, right? As opposed to, where the heck am I going? Something bad’s happening in my country– So we’re going to vet everybody. Everybody’s going to be vetted, right? But these are going to be great people who are going to come and bring businesses and opportunity to America, and they’re gonna pay $5 million. So 200,000 people — remember, we give 280,000 visas a year now for free, not counting the 20 million people who broke into this country for nothing under Biden. But 200,000 people who pay. That’s a trillion dollars that pays for everything, everything. And so I want you to think about that. We give it away for free, and said Donald Trump’s gonna bring in a trillion dollars. For what purpose? To make America better. And it makes perfect sense to me. Thank you.
THE UNITED STATES OF AMERICA
FOR FIVE MILLION $DOLLARS, THE TRUMP CARD IS COMING! Thousands have been calling and asking how they can sign up to ride a beautiful road in gaining access to the Greatest Country and Market anywhere in the World. It’s called THE UNITED STATES OF AMERICA! THE WAITING LIST IS NOW OPEN. To sign up, go to — TRUMPCARD.GOV.