FY2017 EB-5 Visas by Country
January 23, 2018 14 Comments
The US Department of State has published Table V Part 3 of the Report of the Visa Office 2017, which gives a tally of visas issued by country for the Employment Fifth preference (EB-5) in FY2017. If we believe USCIS processing times reports, these should be visas based on investments/petitions from 2015 or earlier. A few points to note:
- Having issued slightly fewer than the annual EB-5 visa quota last year, DOS compensated by going slightly over the quota this year.
- Vietnam and Brazil are the countries with greatest increase in EB-5 visas issued between 2016 and 2017. South Korea showed the largest drop.
- South America is the region with the greatest increase in number of EB-5 visas issued in 2017, and Europe the region with the greatest increase in number of nationalities receiving EB-5 visas.
- Compared with 2016, the 2017 report has more countries taking at least one visa, but fewer countries taking over 20 visas. Kudos to the brave lone souls from Angola, Cameroon, Bolivia, Bulgaria, Tajikistan, and Suriname who immigrated last year though EB-5.
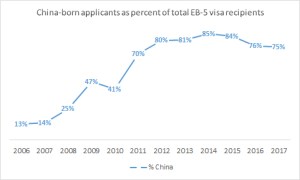
- Countries besides China claimed 25% of the 2017 EB-5 visas (compared with 24% in 2016).
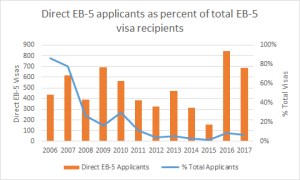
- There were 160 fewer visas based on direct EB-5 investments in 2017 than 2016.
- In addition to the Visa Office Report data on EB-5 visas issued during FY2017, we also have data on applications pending at the National Visa Center at the end of FY2017. (I’ve copied a couple charts below, and you can consult the Visas tab in my master visa/backlog spreadsheet for additional detail and source links.) It’s puzzling to look at the different reports together. For example, one wonders why the drop in visas issued to South Koreans in 2017, when there were 278 visa applications for South Koreans left pending at the end of the year. Or why people from Hong Kong got only 81 EB-5 visas in 2017, when there were 447 Hong Kong applications pending in November 2016 and 423 still pending in November 2017. Vietnamese received a hefty 335 EB-5 visas in 2017, just behind China, but 649 Vietnamese applications were still left pending. In total, DOS issued 2,523 visas in 2017 to applicants from countries other than China, but that still left 3,524 applications from countries other than China pending at NVC as of November 2017. Anyone know the story behind the non-China backlogs at NVC?


For reference, here are my posts on the Visa Office Reports from 2016, 2015, and 2014.
For a running tab of EB-5 visas issued through consular processing by country, see the Department of State’s report of Monthly Immigrant Visa Issuances. (The visas with “5” as the second digit in the three-digit code are EB-5 visas: C51, C52, C53, T51, T52, T53, R51, R52, R53, I51, I52, I53.)
UPDATE: I’ve added a EB-5 Timing page to collect links to data and posts related to EB-5 visa availability, visa allocation, and wait times. If you would like to order a personalized timing estimate, see the EB-5 Timing Estimates Page.
Discover more from EB-5 Updates
Subscribe to get the latest posts sent to your email.

Suzanne,
Thank you for the excellent work, data and spreadsheets.
Given your expectation that India and Vietnam would also reach quota limits (when?), I wonder if you would be able to break down the waiting list, processing time, etc for these two countries – in addition to China.
Wolfsdorf has a comment on this: https://wolfsdorf.com/blog/vietnam-eb-5-demand-exceeds-expectations/
I don’t know that I’ll have time soon to put together another prediction model, but my current spreadsheet includes the data you’d need to make one yourself for India or Vietnam. (The tabs have available data on pending visa applications by country and I-526 petitions by country.) https://www.dropbox.com/s/gjgkr1kjtcj8tf2/BacklogCalc.xlsx?dl=0
And here’s a nice paper explaining how the numerical limits work: http://trac.syr.edu/immigration/library/P12189.pdf
Based on the data available , it seems Vietnam , Brazil ,and Taiwan have more consumption than India , still do you see India getting cut off date soon ?
Suzanne,
I just saw an email from CMB that one of their projects received the first I-526 approval just now. The application was filed in Aug 2016, which means a waiting time of 16 months.
I was wondering how this application was approved in such a short time, since the applications of Nov 2015 were being processed as at the end-Dec-2017. How could any application filed after Nov 2015 be processed now?
Thank you.
The IPO’s posted processing times are estimates, not hard dates. Keep in mind that the IPO often adjusts these dates retroactively, just like USCIS does in their monthly Visa Bulletins.
IPO has stated that they try to process applications on a strict First In First Out order, but they can’t always do so in practice. Furthermore, they appear to sometimes group together some applications for the same project, although this was claimed to be the first I-526 approval for the project, so that theory wouldn’t be applicable in this case.
Hi Suzanne, thanks for all the data collection and explanation you do on here.
Based on USCIS data, is it possible to calculate the total investment generated by one nationality of investors (for example, China)?
Last year the AP created a graph that included total number of Chinese EB-5 investors in the US, as well as their total investment value. I can see they draw the total number of Chinese investors from these reports, but can’t figure out how they would reverse-engineer the total investment value, given that we don’t know how many of those receiving visas are investors vs. family members.
Here’s the AP story: https://www.apnews.com/22a5d2a940024cffa47558d7b051368b
Is that data on the actual investment value available somewhere, or am I missing something?
Any help or pointers is much appreciated,
Matt
Note on my comment above: fiddling around with the numbers of visas and the investment totals given by the AP, I’ve found that if you assume 2.86 visas per investment, you get very close investment totals to what the AP gives. But each 2014-2016 that number varies just a tiny bit (2.8606, 2.8604, 2.8571), so it would appear AP wasn’t just using a simple multiplier, and had some other source of data.
Again, any suggestions or pointers are appreciated.
Matt
The USCIS data by country (obtained via FOIA request by IIUSA, and available for purchase from IIUSA) shows a total 27,754 I-526 approvals for China-born investors from 1992 through 2016. That’s not itemized by TEA/non-TEA investment, however. Otherwise, I don’t have relevant data besides the DOS Annual Report of the Visa Office. DOS has said that EB-5 visas have averaged 2.8 visas per principal.
Hi Suzanne,
Thanks for putting together all data, it’s so much easier to view visa status & estimated processing. Is there any source to check status of visa numbers issued? Is visa number reaching its cap for FY18?
Dear author,
I am a Chinese investor whose priority date is 12/8/2014. So based on the statistics you have listed here, is it legitimate to estimate the current date for me is some day in early 2020?
At the IIUSA conference on 4/23/2018, Charlie Oppenheim estimated that as of 9/1/2019, visas would be issued to Chinese with priority dates of 10/15/2014. So sounds like you might be looking at more like late 2020.
Great data collection. Thanks… Do you foresee a quota backlog for India. May I know when will it start have a priory date ?
Hi Suzzane,
I think this comes from the reason: the Cut – off – date of Visa Bulletin is the first factor for NVC to consider.
It is simple that too many investors from China apply from very soon.
If cut-off-date is reviewed by NVC in 2017 is 10/02/2014 (just for example):
Firstly Chinese investors get 7% visa (maximum quota), Vietnam investors get 4.7% (all Vietnamese investors satisfy cut-off-date), then Brazil 2.8% (all Brazil investors satisfy cut-off-date), bla bla all the world…
Next step, the rest visas available (68%) will be apply for the rest Chinese investors satisfying cut-off-date.
And the visas from the countries other than China still be pending just because they are not satisfy the cut- off-date.
Please comment me your oppinion!
Best reagards
Pingback: Brazilians are getting in on the EB-5 game in a major way – Windsor